

Medicare and Social Security play a central role in the lives of tens of millions of older adults and people with disabilities in the U.S., in the form of health insurance from Medicare and retirement or disability income from Social Security. Yet, even with Medicare coverage, beneficiaries can face substantial out-of-pocket health care costs, which can erode the financial support provided by Social Security. Medicare Part B and D premiums and cost sharing alone account for nearly one-fourth of average monthly Social Security benefits, not taking into account other health care expenses, such as dental services, home care, or care in a nursing home, or premiums for supplemental coverage. While most Medicare beneficiaries have other sources of income in addition to Social Security, more than one third of Social Security recipients age 65 and older rely on Social Security for half or more their income. Additionally, many Medicare beneficiaries live on relatively low incomes: one in four Medicare beneficiaries had income below $21,000 per person in 2023, while half had income below $36,000 per person.
Medicare beneficiaries with low incomes and limited financial resources can get help paying for out-of-pocket costs and services not covered by Medicare if they qualify for and receive full Medicaid benefits, which covers long-term care, vision, and dental care. They can also receive help if they are enrolled in the Medicare Savings Programs, which pay for Medicare’s premiums and, in most cases, cost-sharing requirements. However, the recently enacted tax and spending bill includes provisions that are projected to result in fewer low-income Medicare beneficiaries accessing these benefits, and reduce household resources for individuals in the bottom of the income distribution, including households with Medicare beneficiaries. And even today, not all low-income Medicare beneficiaries who are eligible for these benefits are receiving them, while others may have income or assets just above the qualifying thresholds.
To document the affordability challenges posed by out-of-pocket health care costs for people with Medicare, this brief analyzes out-of-pocket health care costs as a share of Social Security income and total income, including other sources of income in addition to Social Security. Due to differences in the underlying data sources, the analysis presents average out-of-pocket spending as a share of average Social Security income on a per person basis, and a broader range of measures – average, median, 75th and 90th percentile – for out-of-pocket spending as a share of total income. (See Methods for more details and data sources).
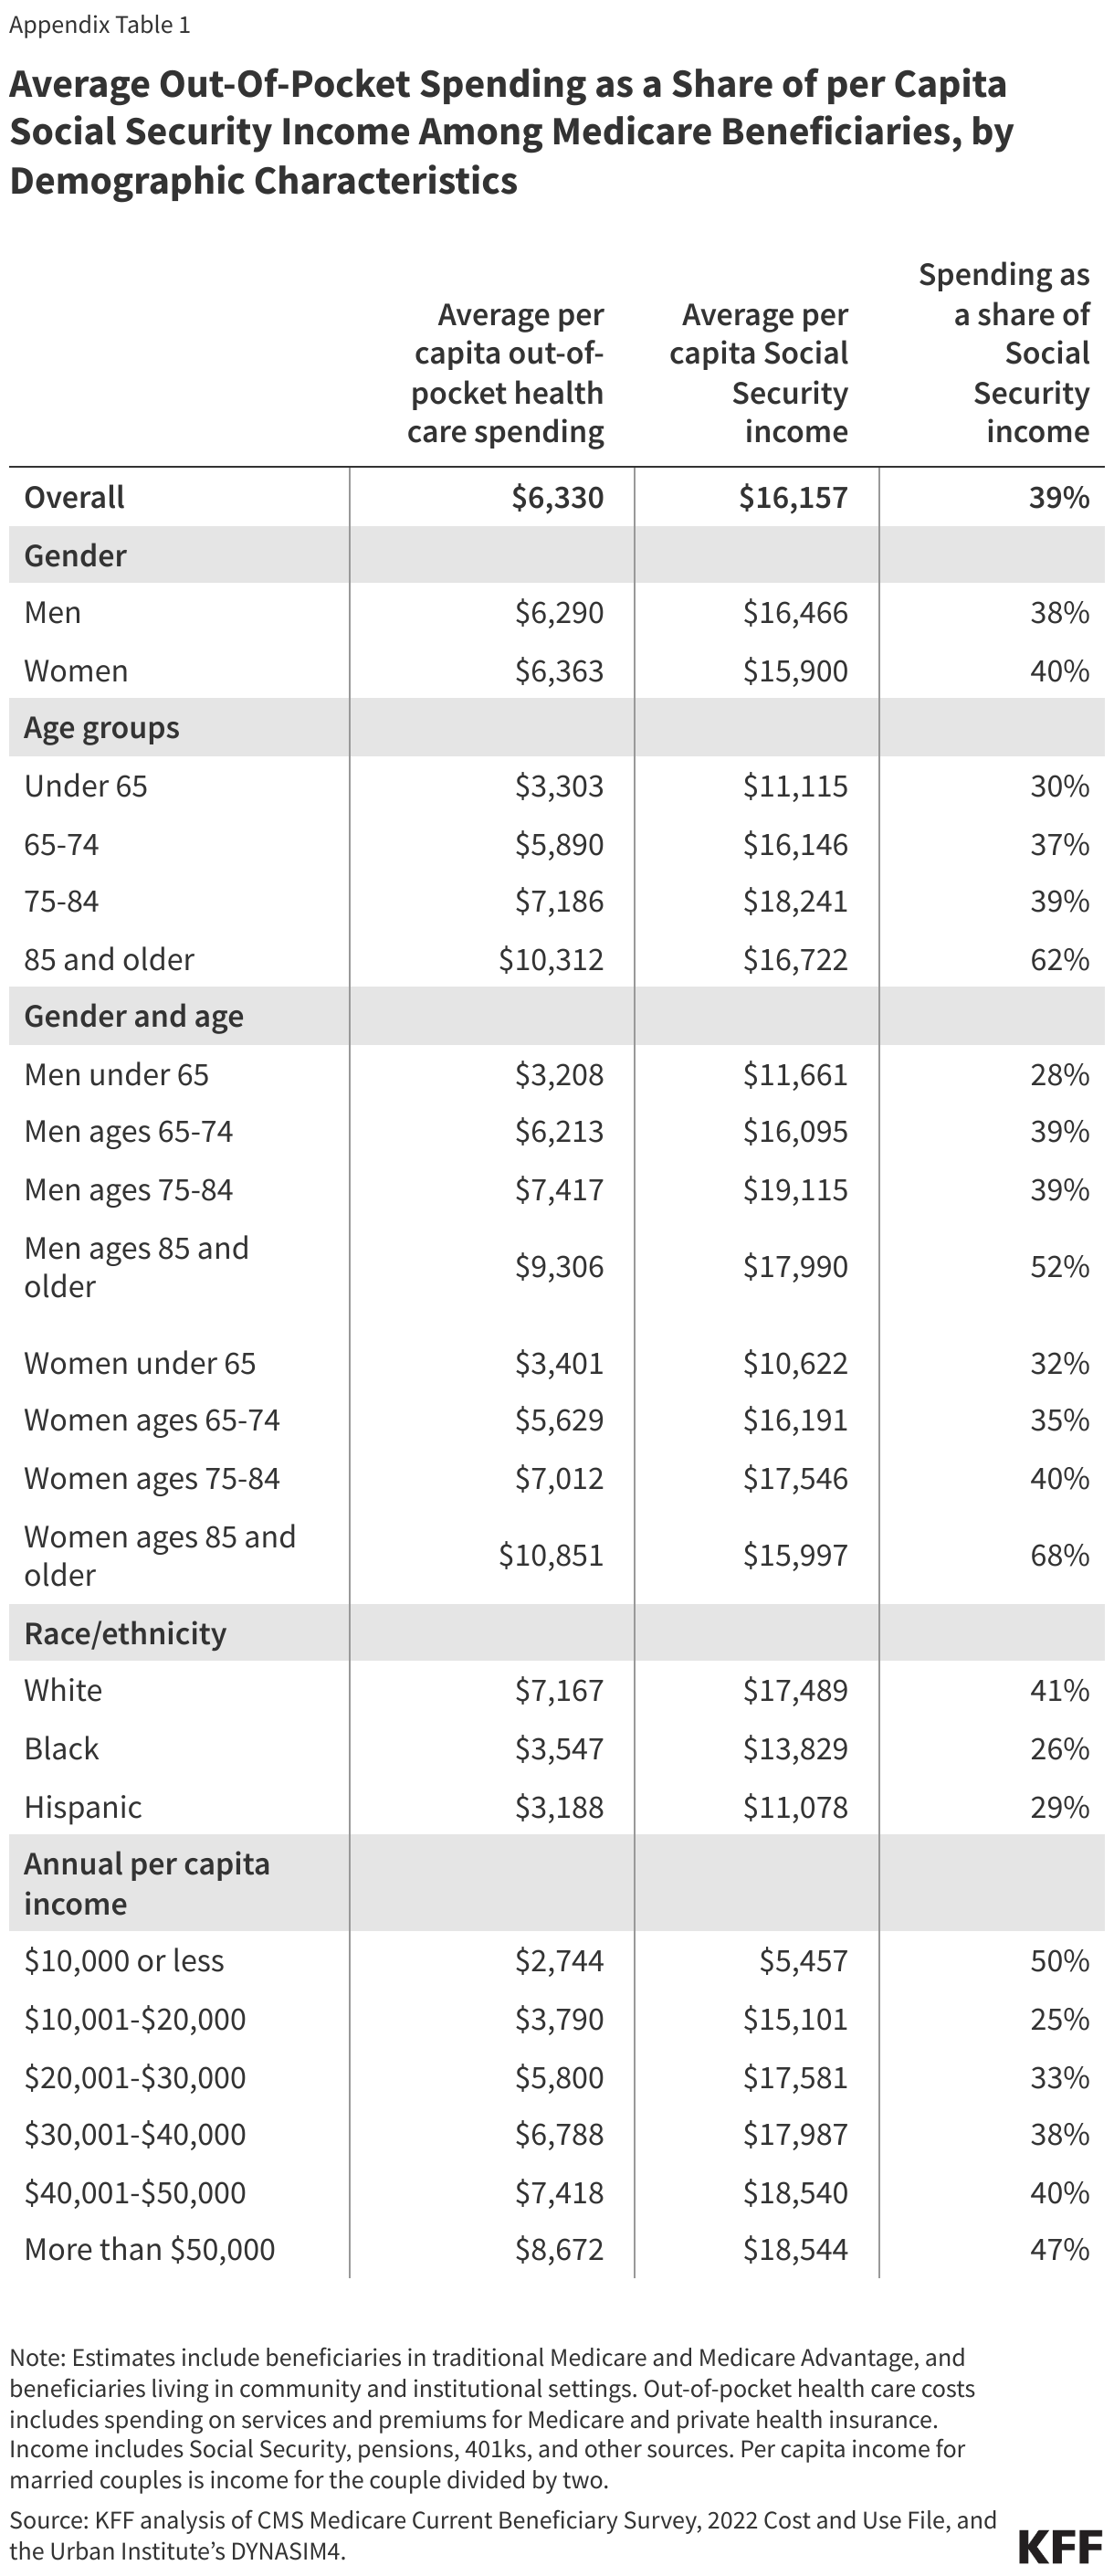
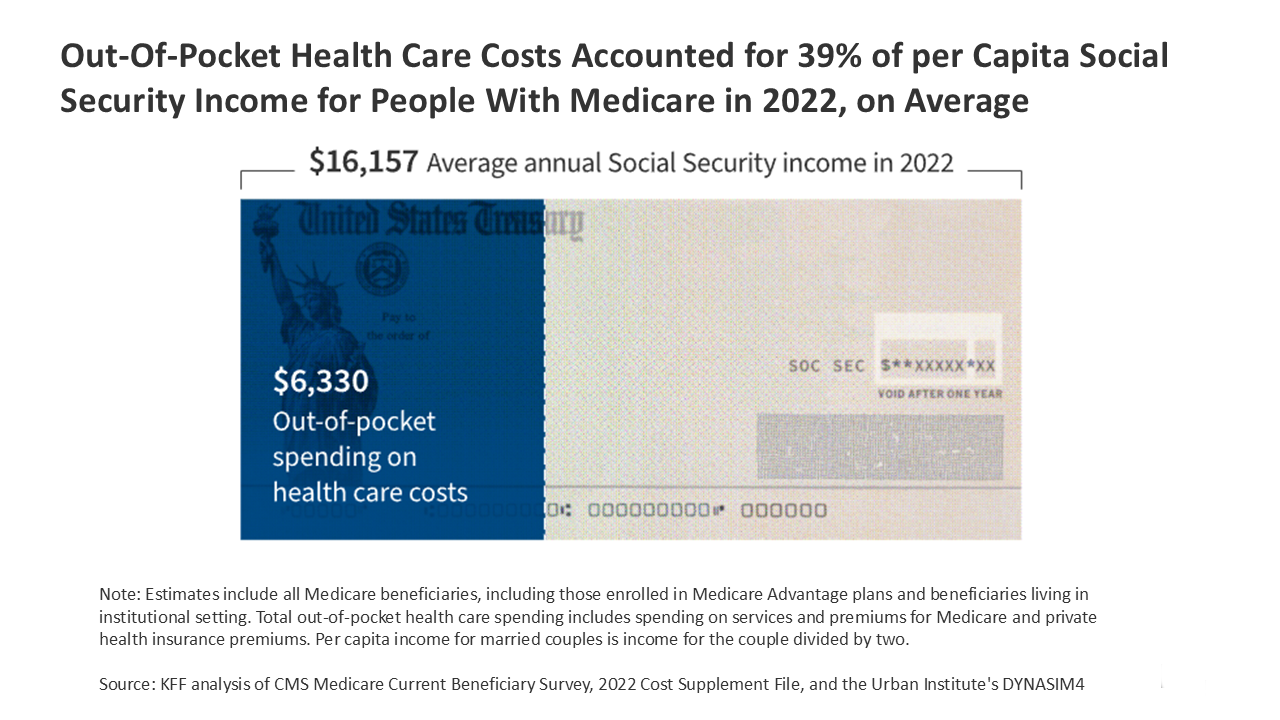
Out-of-pocket health care spending by Medicare beneficiaries accounted for 39% of Social Security income per person in 2022, on average
In 2022, Medicare beneficiaries spent a total of $6,330 out of pocket on health care costs, on average, including premiums for Medicare and costs for Medicare-covered services and services Medicare doesn’t cover, like dental, vision, and hearing services and long-term services and supports, while average per capita income from Social Security was $16,157 (Figure 1, Appendix Table 1).
Figure 1
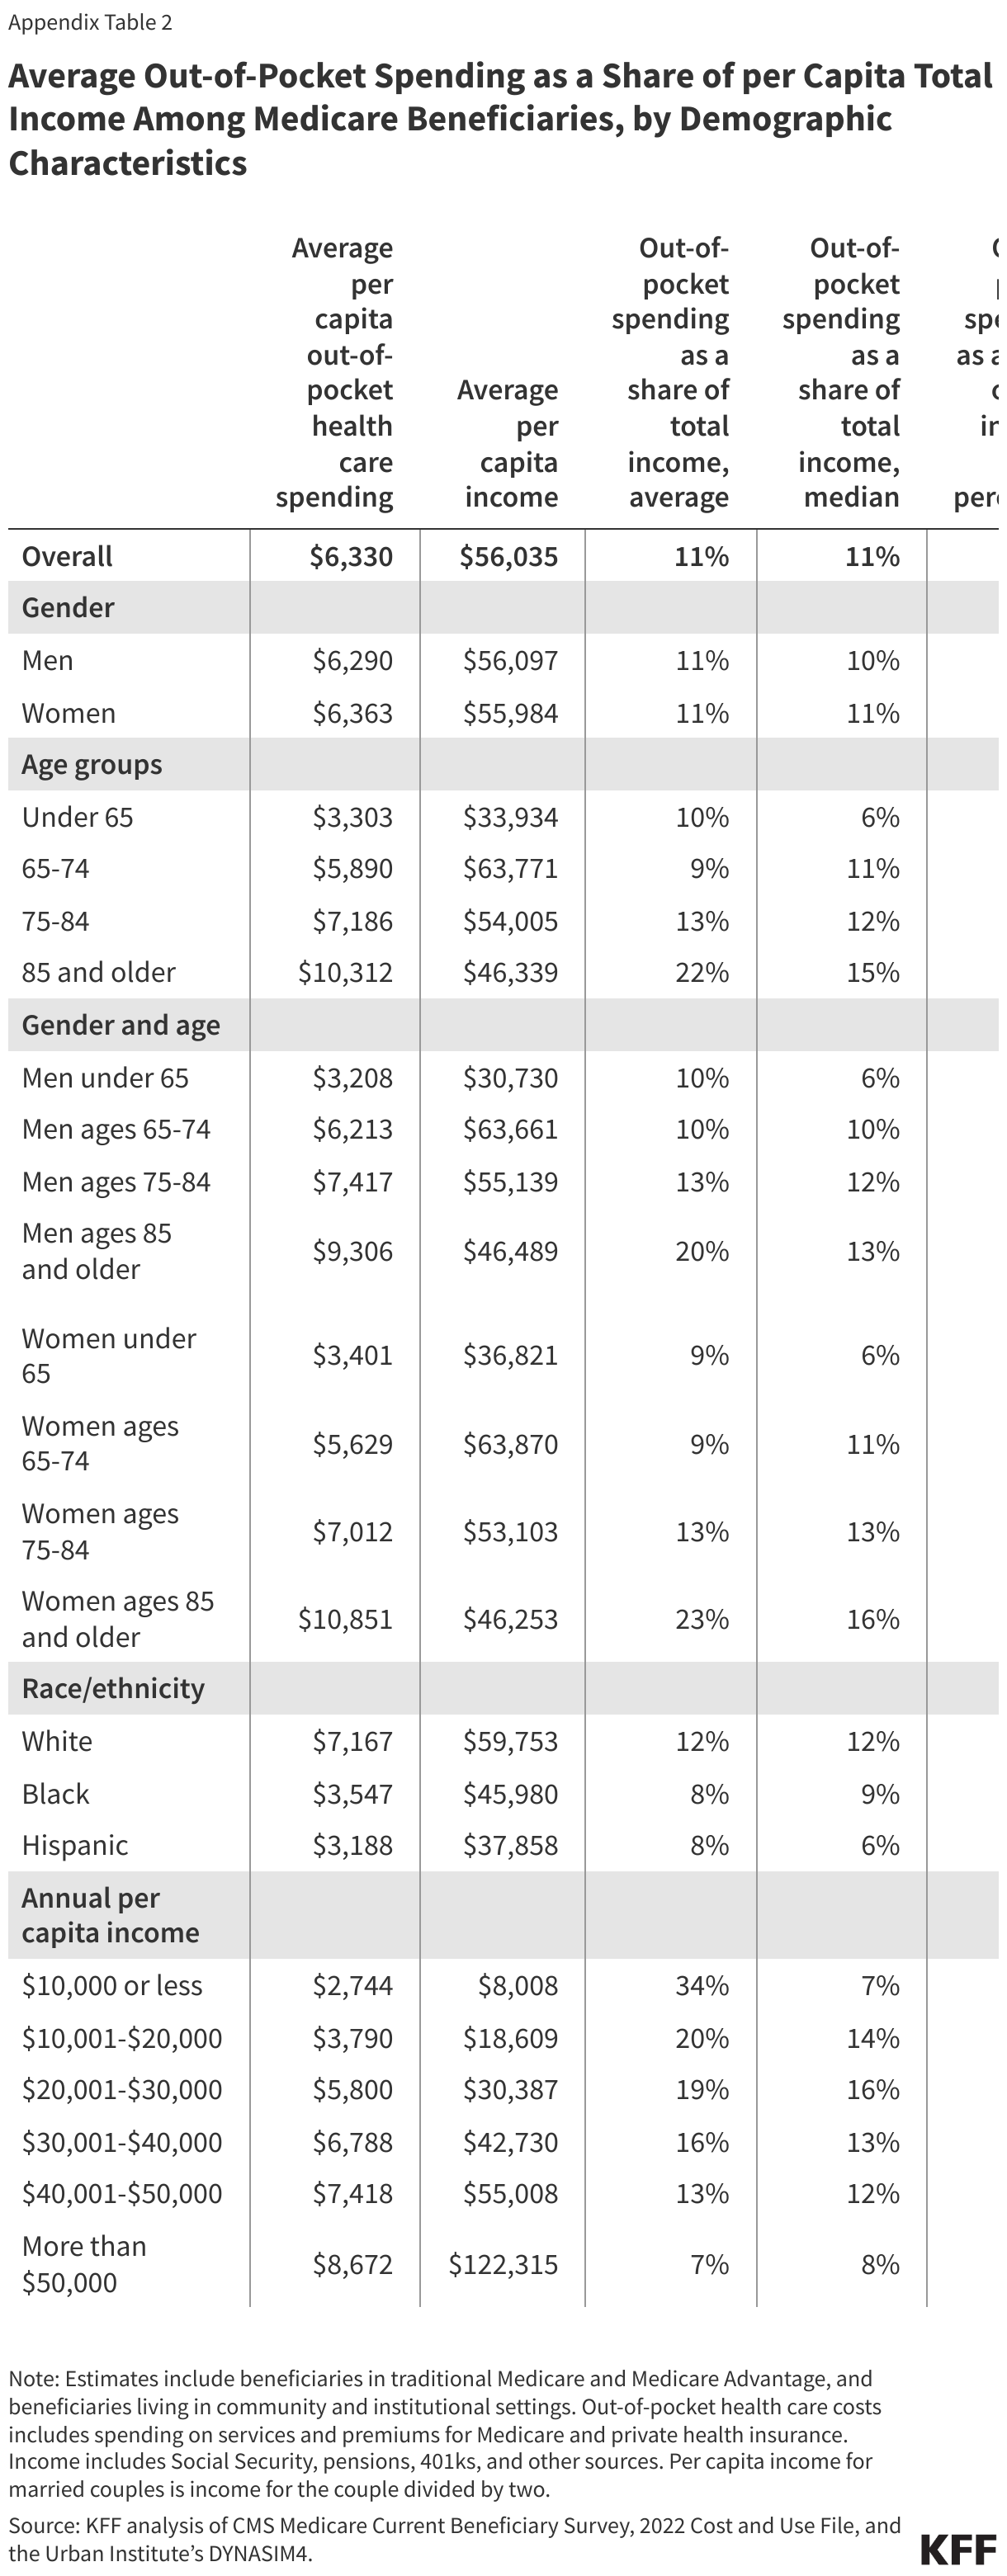
Medicare beneficiaries spent 11% of their total per capita income on out-of-pocket health care costs, on average, but 1 in 4 beneficiaries spent at least 21% and 1 in 10 beneficiaries spent 39% or more
Taking into account other sources of income in addition to Social Security, out-of-pocket spending on health care amounted to 11% of total per capita income for Medicare beneficiaries in 2022, on average (Figure 2). Out-of-pocket health care costs represent a smaller share of total income than Social Security income because most beneficiaries have other sources of income, such as pensions, 401ks, or income from savings. In 2022, Social Security income accounted for 29% of total income per Medicare beneficiary, on average. Out-of-pocket spending consumed a larger share of income for some Medicare beneficiaries, with one in four (15 million beneficiaries) spending 21% or more and one in 10 (6 million) spending 39% or more.
Figure 2
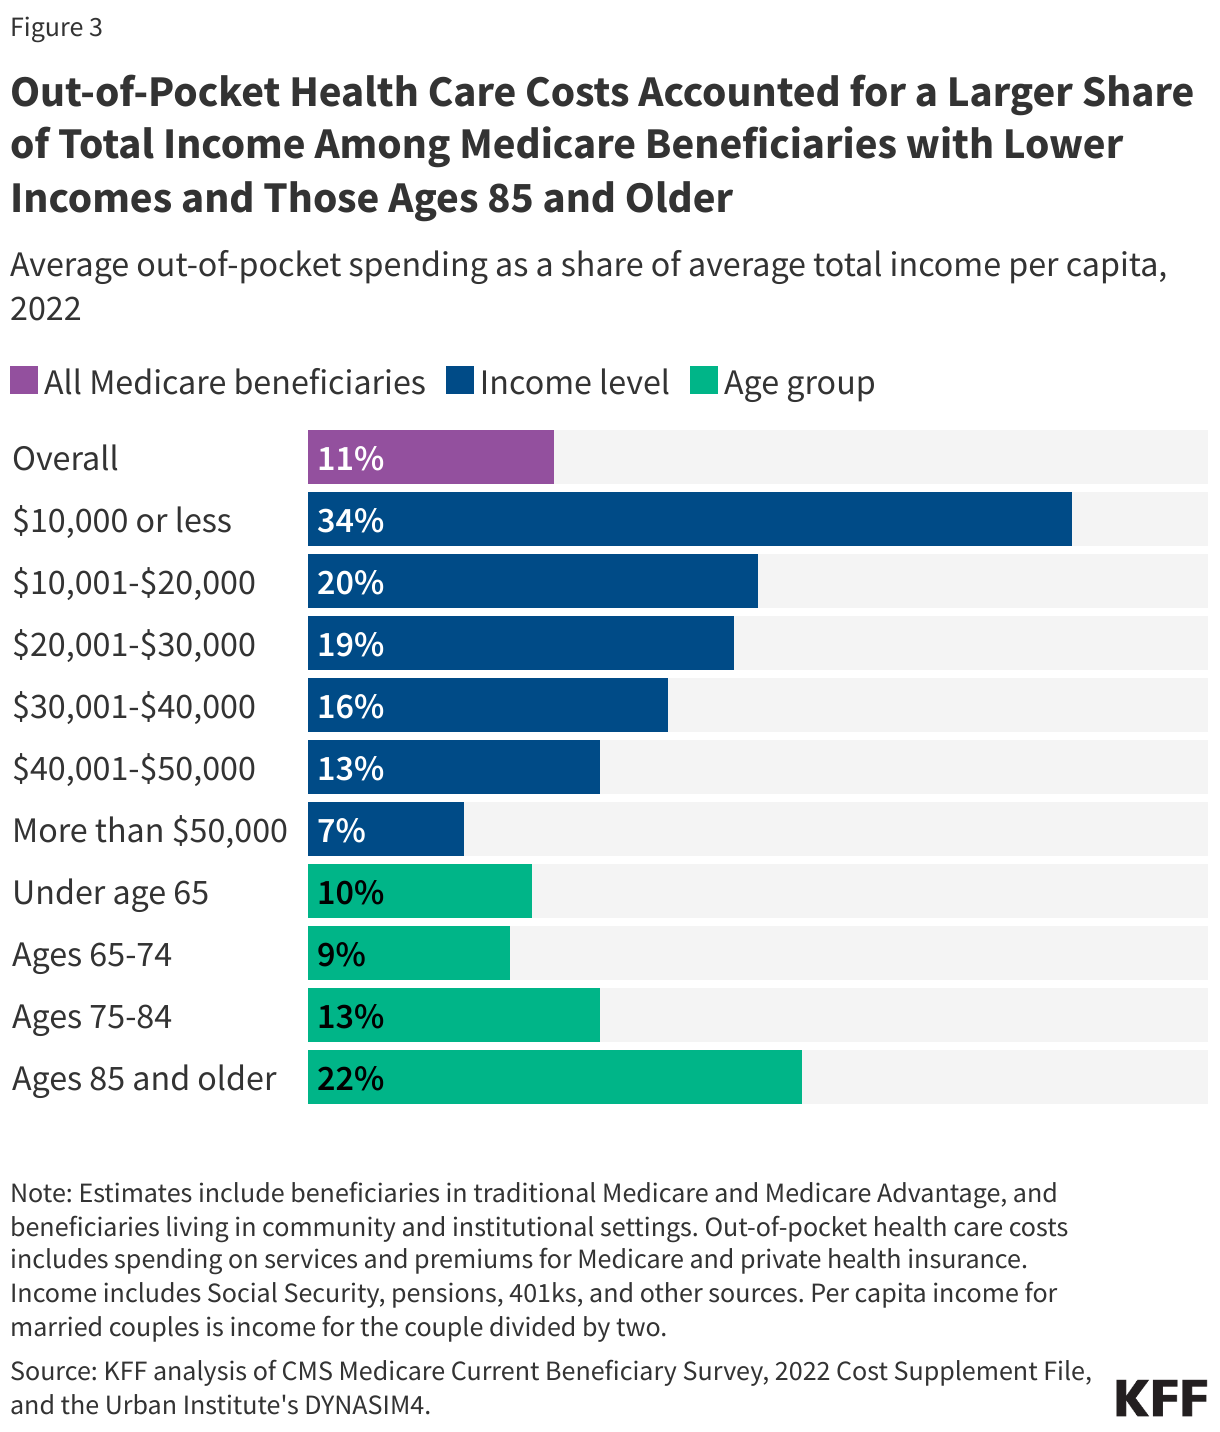
The health care spending burden is higher for some Medicare beneficiaries, including those with lower incomes and those ages 85 and older
On average, out-of-pocket health care costs accounted for a substantially larger share of per capita total income among Medicare beneficiaries with lower incomes than higher incomes (34% among beneficiaries with incomes of $10,000 or less vs. 7% among beneficiaries with incomes greater than $50,000) (Figure 3). While Medicare beneficiaries with lower incomes have lower out-of-pocket health care costs than higher income beneficiaries, on average, their out-of-pocket costs account for a larger share of their lower incomes. Assistance from Medicaid and the Medicare Savings Program can help limit out-of-pocket spending for Medicare beneficiaries with the lowest incomes, but not all low-income beneficiaries qualify for or receive help from these programs. Without some form of financial assistance, lower-income beneficiaries may be more likely to forego needed care since they are less likely than higher-income beneficiaries to be able to afford services with high cost-sharing requirements or services not covered by Medicare, like dental services or long-term services and supports.
Medicare beneficiaries ages 85 and older spent a larger share of their income on out-of-pocket health care costs than younger beneficiaries (22% vs. 9% among beneficiaries ages 65-74), on average. Medicare beneficiaries ages 85 and older have much higher average out-of-pocket health care costs than those ages 65-74, largely due to higher out-of-pocket spending on long-term care, which accounts for more than half of total out-of-pocket spending on all services for those ages 85 and older. Beneficiaries in the oldest age cohort also have lower per capita total income than younger aged beneficiaries, on average, likely due in part to lower income from earnings after retirement. (For details on additional demographic groups, see Appendix Table 1 and Table 2).
Methods
Data on out-of-pocket health care spending is from the Centers for Medicare & Medicaid Services (CMS) Medicare Current Beneficiary Survey, 2022 Cost Supplement File (the most recent year of data available). The sample includes 59.9 million people with Medicare in 2022 (weighted), including beneficiaries in traditional Medicare and Medicare Advantage and those living in the community and in facilities, excluding beneficiaries who were enrolled in Part A only or Part B only for most of their Medicare enrollment in 2022 and beneficiaries who had Medicare as a secondary payer.
The Cost Supplement File links Medicare claims to survey information reported directly by beneficiaries. The file collects out-of-pocket information on inpatient and outpatient hospital care, physician and other medical provider services, home health services, durable medical equipment, long-term and skilled nursing facility services, hospice services, dental services, hearing services, vision services, and prescription drugs.
Survey-reported out-of-pocket payments are those payments made by the beneficiary or their family, including direct cash payments and Social Security or Supplemental Security Income (SSI) checks paid directly to nursing homes. Out-of-pocket spending on premiums is derived from administrative data on Medicare Part A, Part B, Part C (Medicare Advantage), and Part D premiums paid by each sample person along with survey-reported estimates of premium spending for other types of health insurance beneficiaries may have (including Medigap, employer-sponsored insurance, and other public and private sources).
Starting in 2019, the MCBS introduced an imputation method that uses Medicare Advantage encounter data to improve estimation of medical events and costs for Medicare Advantage enrollees and account for unreported Medicare Advantage utilization. Because data for Medicare Advantage enrollees is imputed, estimates of total average out-of-pocket spending in this analysis may be conservative.
Income data are based on both beneficiaries’ self-reported income in the MCBS and estimates from the Urban Institute’s Dynamic Simulation of Income Model (DYNASIM4). DYNASIM4 is a dynamic microsimulation model that projects the population and analyzes the long-term distributional consequences of retirement and aging issues. DYNASIM4 takes into account income from all sources, including Social Security, wages, pensions, and asset income including withdrawals from IRAs. The simulation is aligned to the 2024 Social Security Trustees’ intermediate cost economic and demographic projections. DYNASIM4 generates average and percentiles of per capita Social Security and total income for specific demographic groups. It calculates average per capita Social Security and total income for married couples by dividing income for the couple by two. KFF adjusts beneficiaries’ self-reported income in the MCBS with estimates from DYNASIM to adjust for under-reporting of income from certain sources.
For average out-of-pocket spending as a share of average per capita Social Security and average per capita total income, this analysis uses average per capita out-of-pocket spending from the MCBS and average per capita Social Security and total income from DYNASIM. Percentile values of out-of-pocket spending as a share of total income (median, 75th, and 90th) are calculated from MCBS data on out-of-pocket spending and DYNASIM-adjusted income values in the MCBS.
This work was supported in part by AARP Public Policy Institute. KFF maintains full editorial control over all of its policy analysis, polling, and journalism activities.
Nancy Ochieng, Juliette Cubanski, and Tricia Neuman are with KFF. Anthony Damico is an independent consultant.
Appendix Tables