


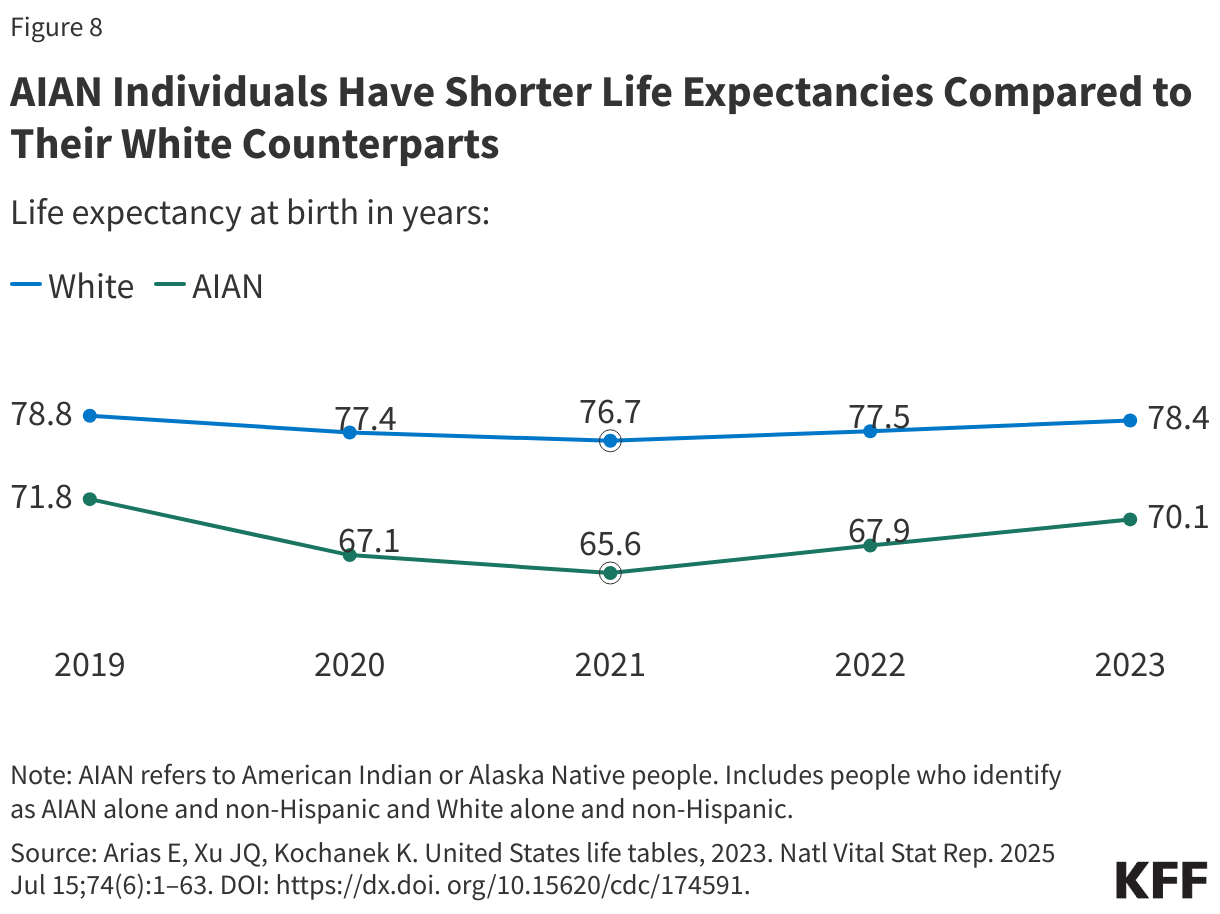
AIAN people have a shorter life expectancy at birth compared to White people (Figure 8). Since 2019, life expectancy has fallen for AIAN people, reflecting the impacts of the COVID-19 pandemic. The existing gap in life expectancy widened between people who identify as AIAN alone and White people from 7 years in 2019 (71.8 vs. 78.8 years) to 8.3 years in 2023 (70.1 years vs 78.4 years).
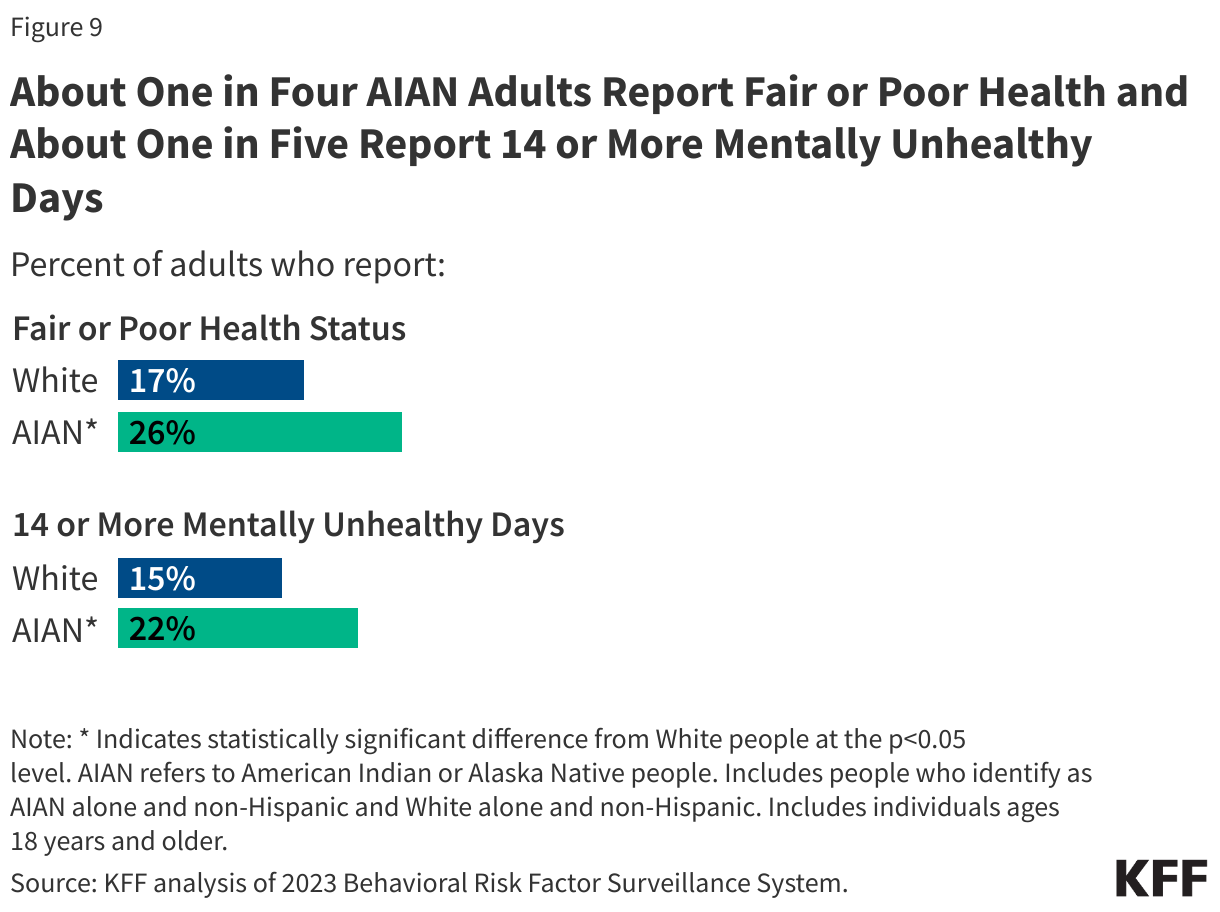
Adults who identify as AIAN alone report poorer health status compared to White adults. About a quarter (26%) of AIAN adults report having fair or poor health status compared to 17% of White people, and roughly one in five (22%) AIAN adults report having 14 or more mentally unhealthy days compared to 15% for White people (Figure 9).
Pregnancy-Related Outcomes and Infant Mortality
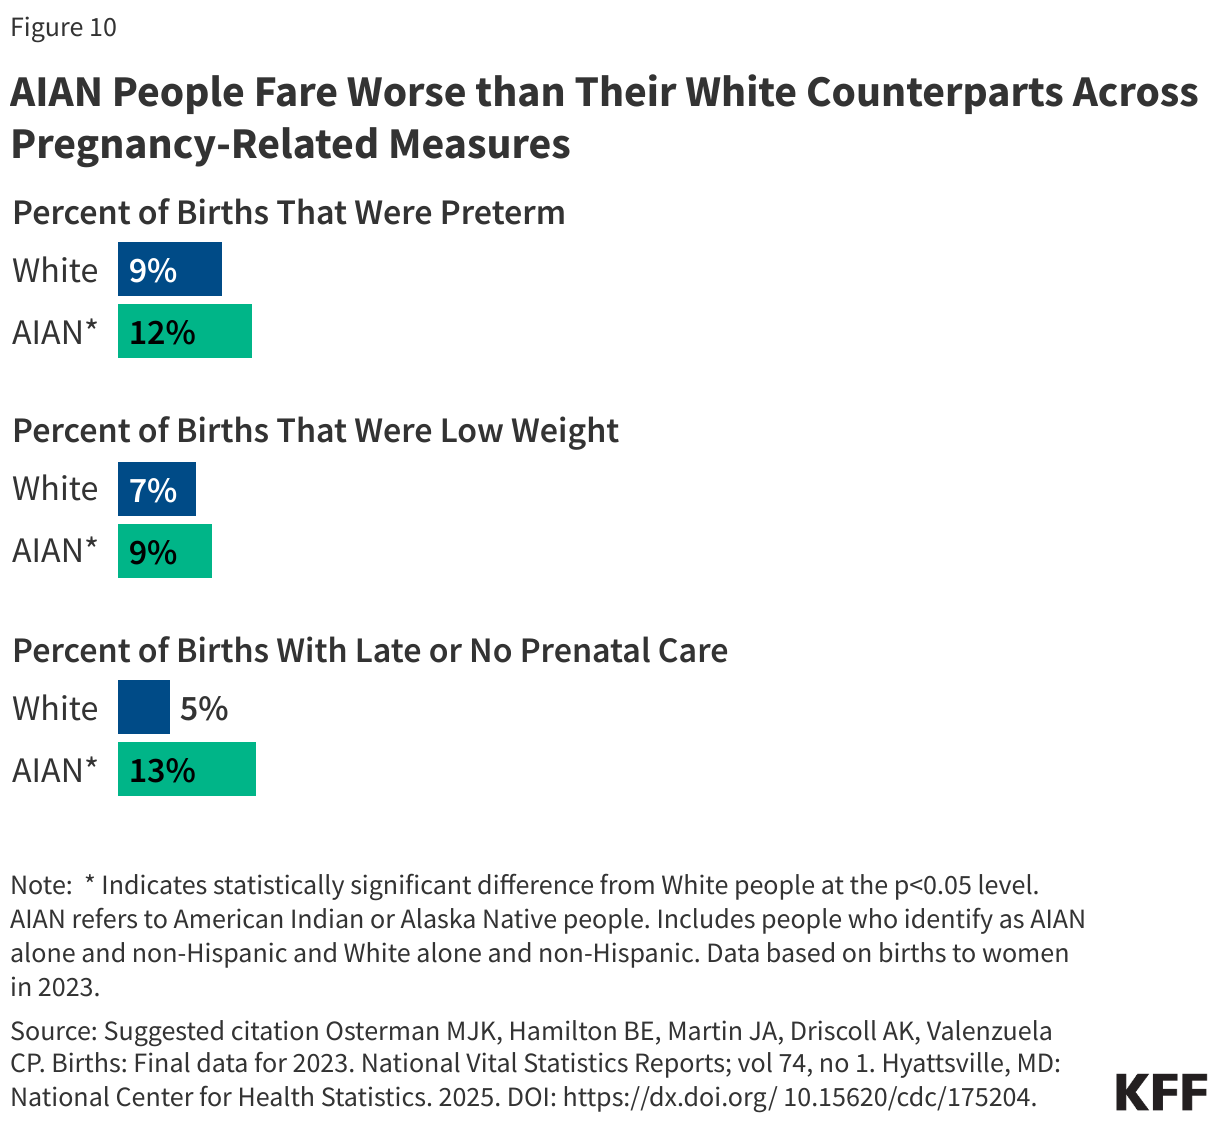
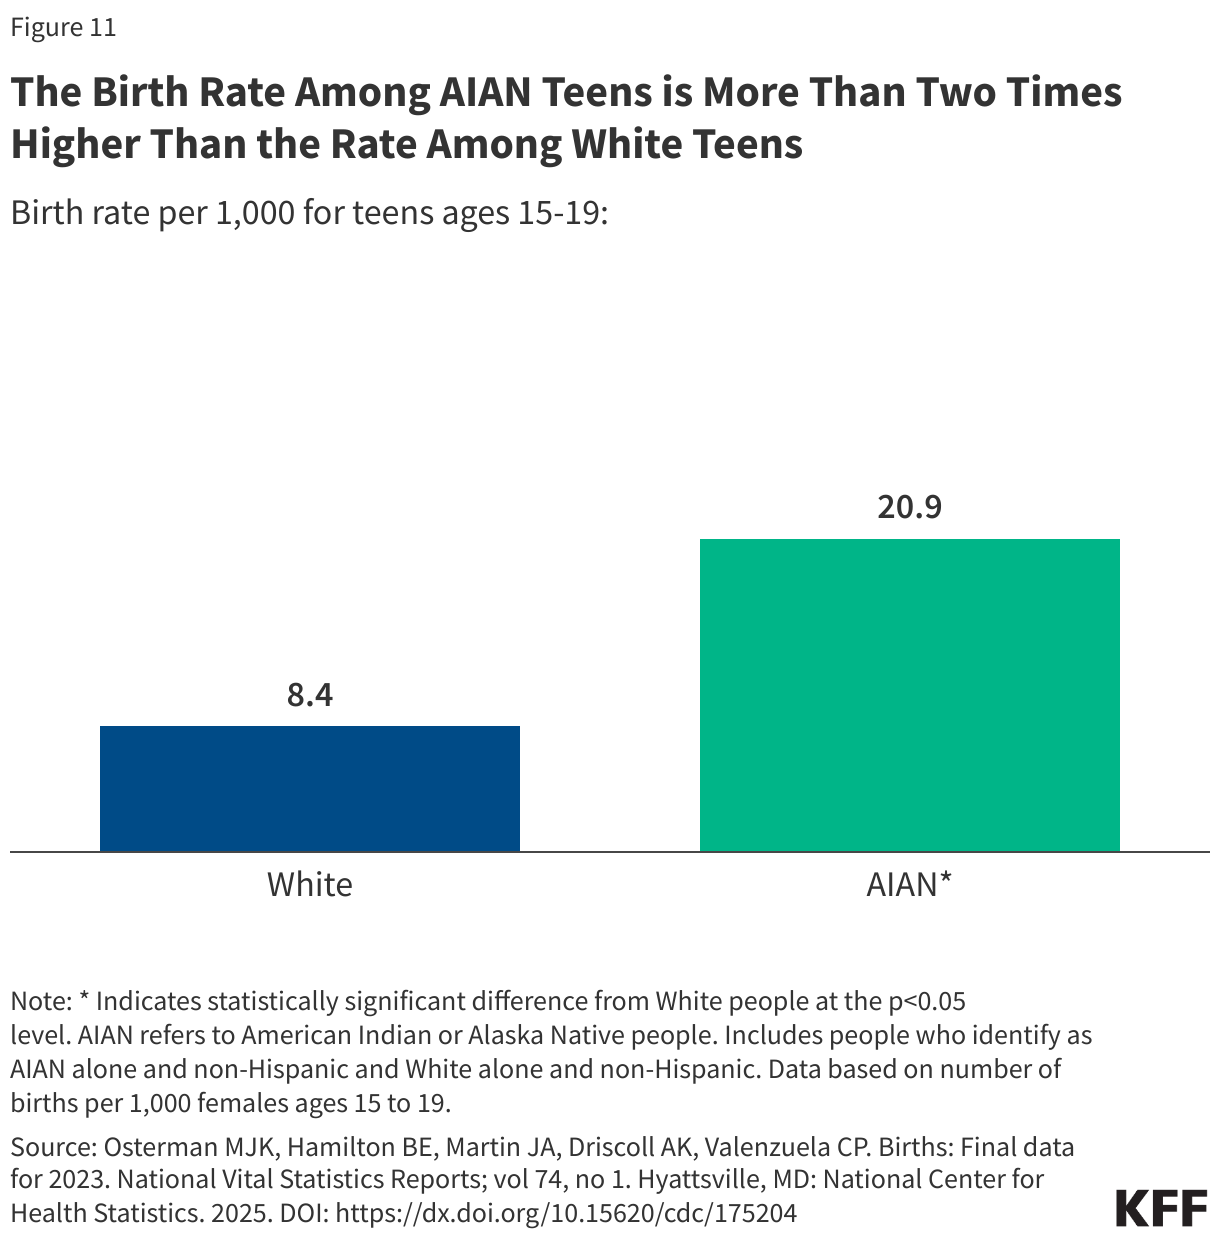
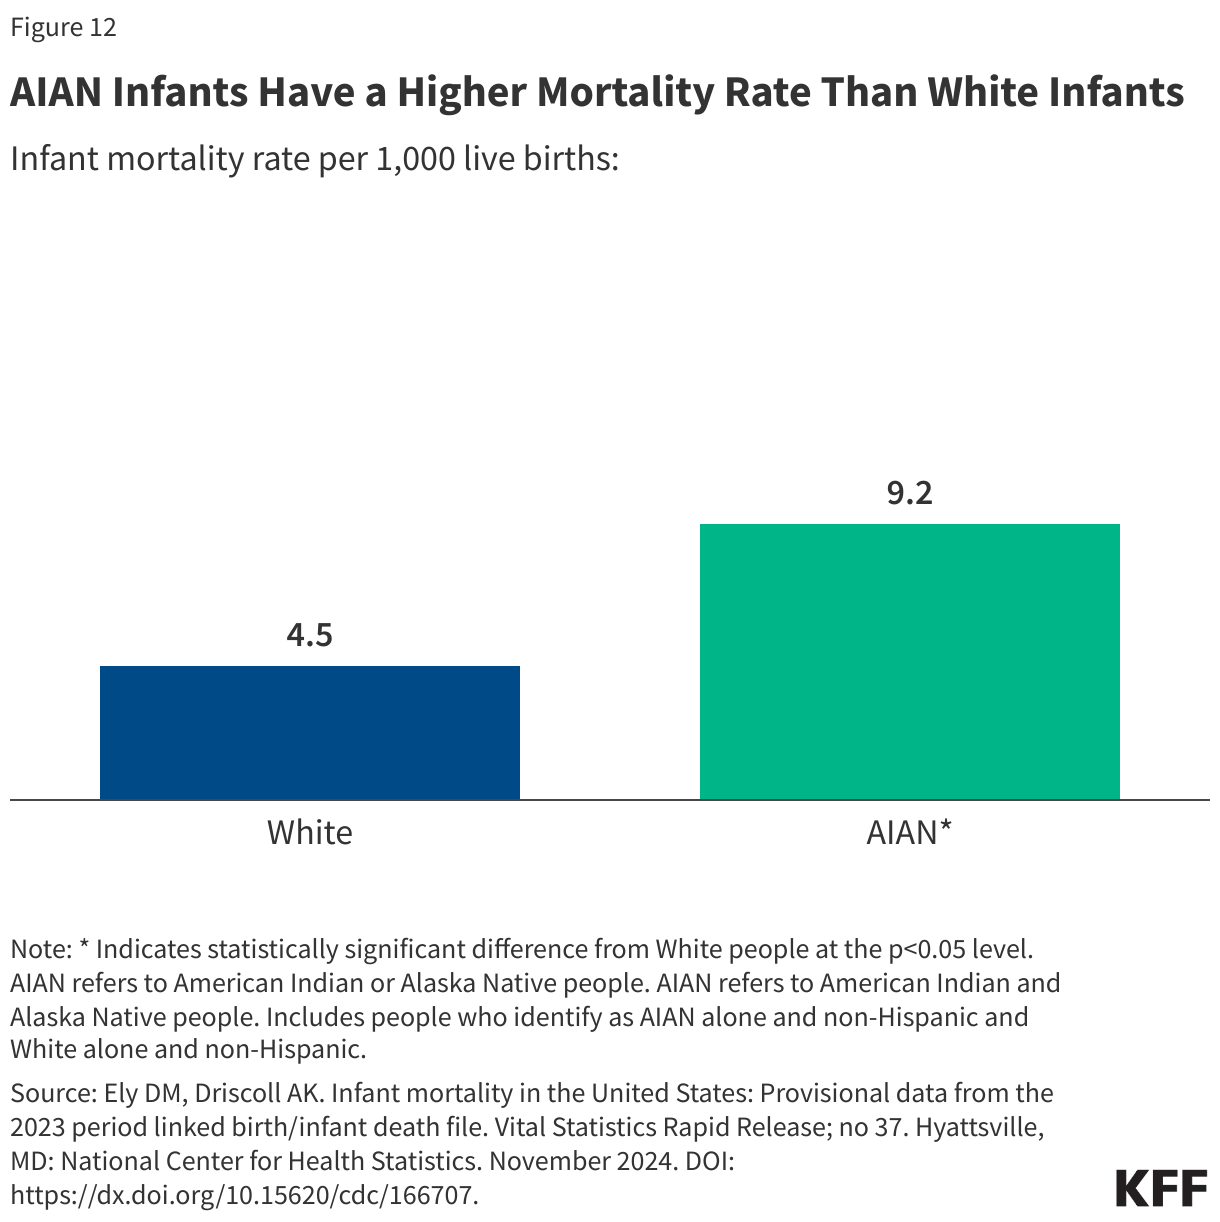
AIAN people fare worse than their White counterparts across multiple measures of birth risks and outcomes. People who identify as AIAN alone have higher shares of preterm births compared to their White counterparts (12% vs. 9%), low birthweight births (9% vs. 7%), and births for which they received late or no prenatal care (13% vs. 5%) (Figure 10). The birth rate among teens who identify as AIAN alone is more than two times higher than the rate for White teens (Figure 11). AIAN infants have a mortality risk that is twice as high as that of White infants (9.2 vs. 4.5 per 1,000 live births) (Figure 12).
Chronic Diseases
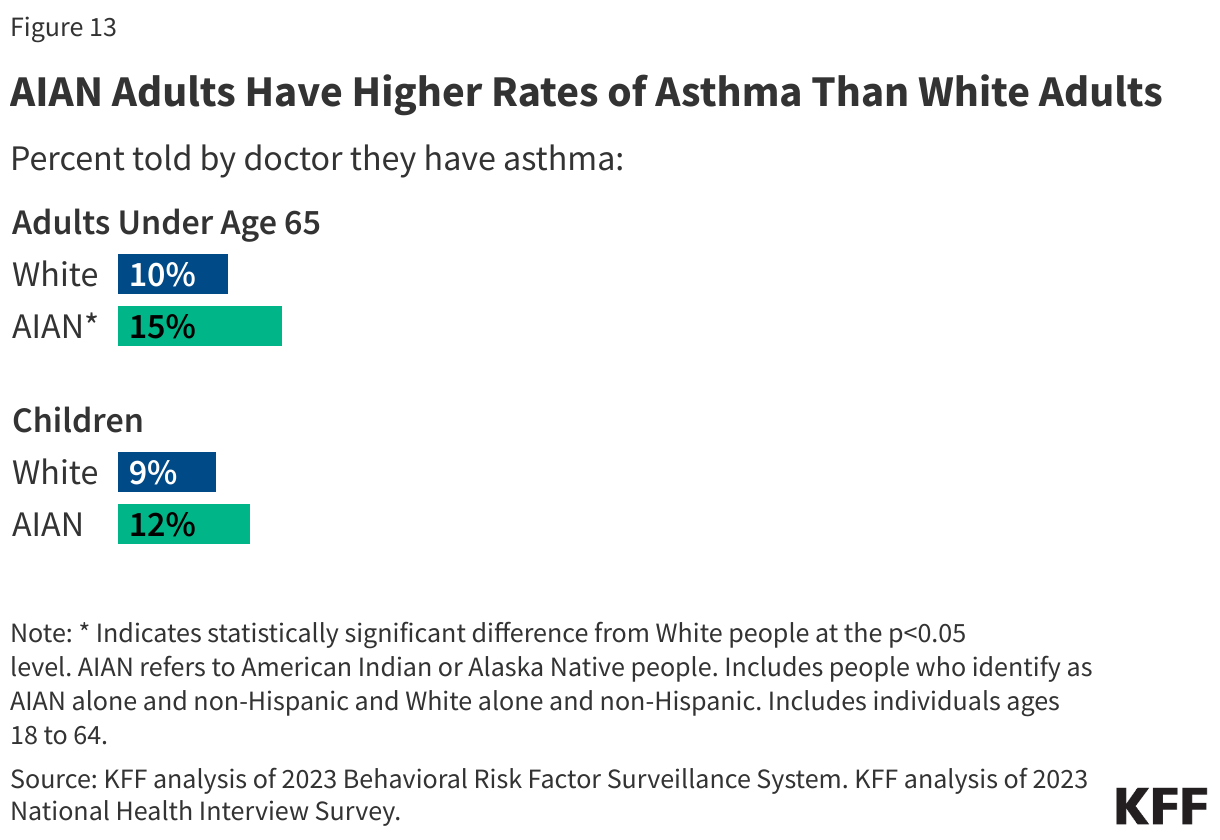
AIAN people have higher rates of certain conditions than their White counterparts. Adults who identify as AIAN alone are more likely to have asthma than White adults (15% vs. 10%) (Figure 13). AIAN adults also have higher rates of obesity than White adults. Among children, the prevalence of asthma was not significantly different between AIAN and White children, with 12% of AIAN children and 9% of White children reporting having asthma.
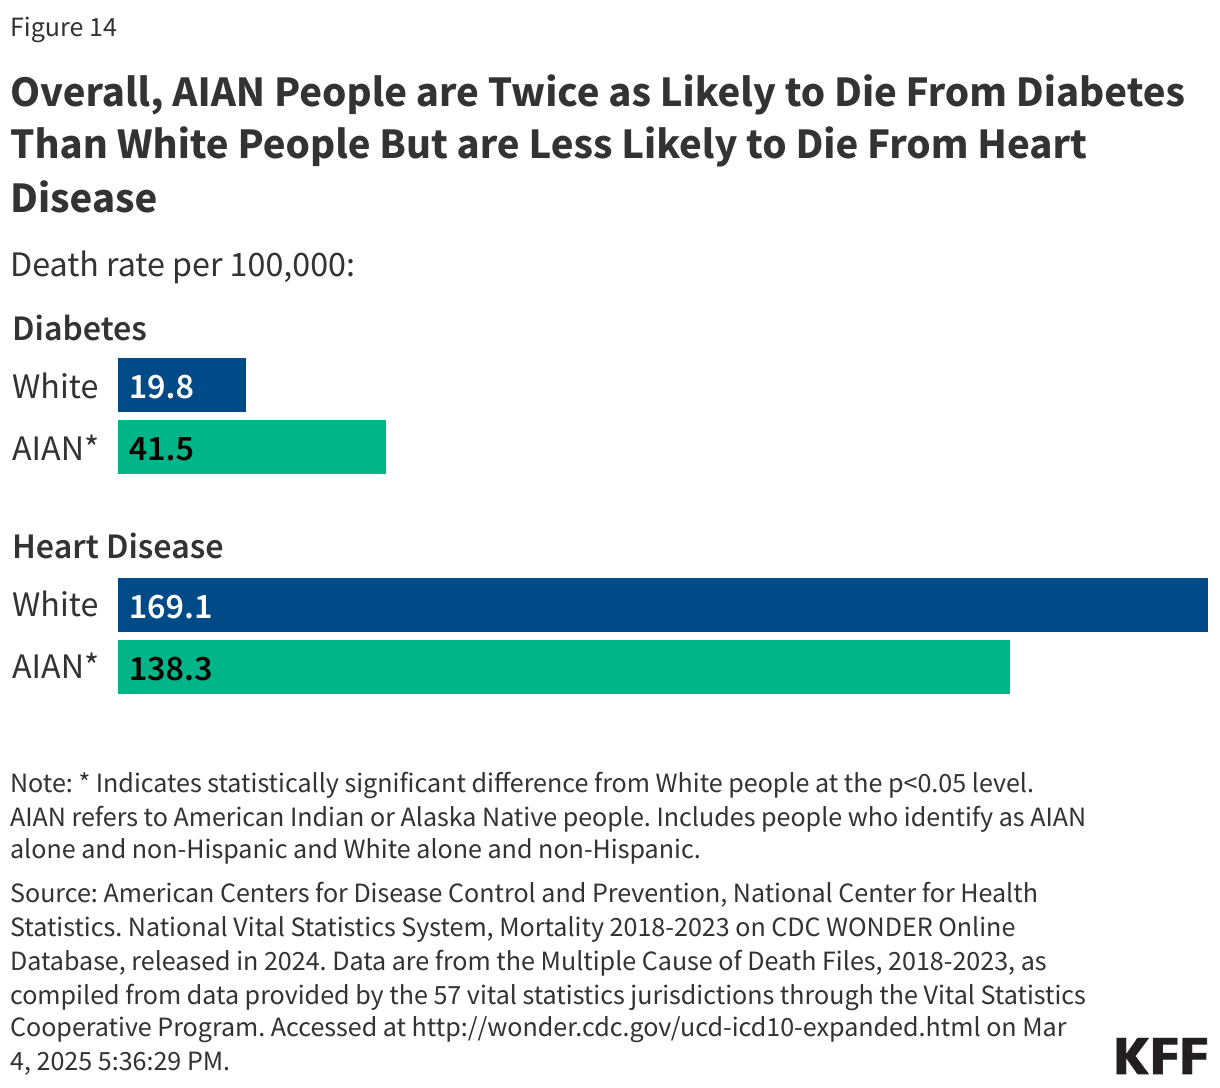
AIAN people have the highest rate of diabetes across racial and ethnic groups, with 18% of adults who identify as AIAN alone reporting being told by a doctor they have diabetes compared to 11% of White adults. Researchers suggest that higher diabetes prevalence among AIAN people may be linked to historical forced relocation, changes to traditional lifestyles, and reliance on government food assistance programs. AIAN people are about two times more likely to die from diabetes compared to White people (41.5 vs. 19.8 per 100,000) (Figure 14). In contrast, AIAN adults have similar rates of heart disease to White adults (8% vs. 7%) and lower heart disease mortality rates than White people (138.3 vs. 169.1 per 100,000). However, it is important to note that race misclassification on death certificates is particularly common for AIAN people and likely leads to underestimates of AIAN mortality rates, with research showing that at least 30% of individuals who identify as AIAN alone are misclassified on their death certificates.
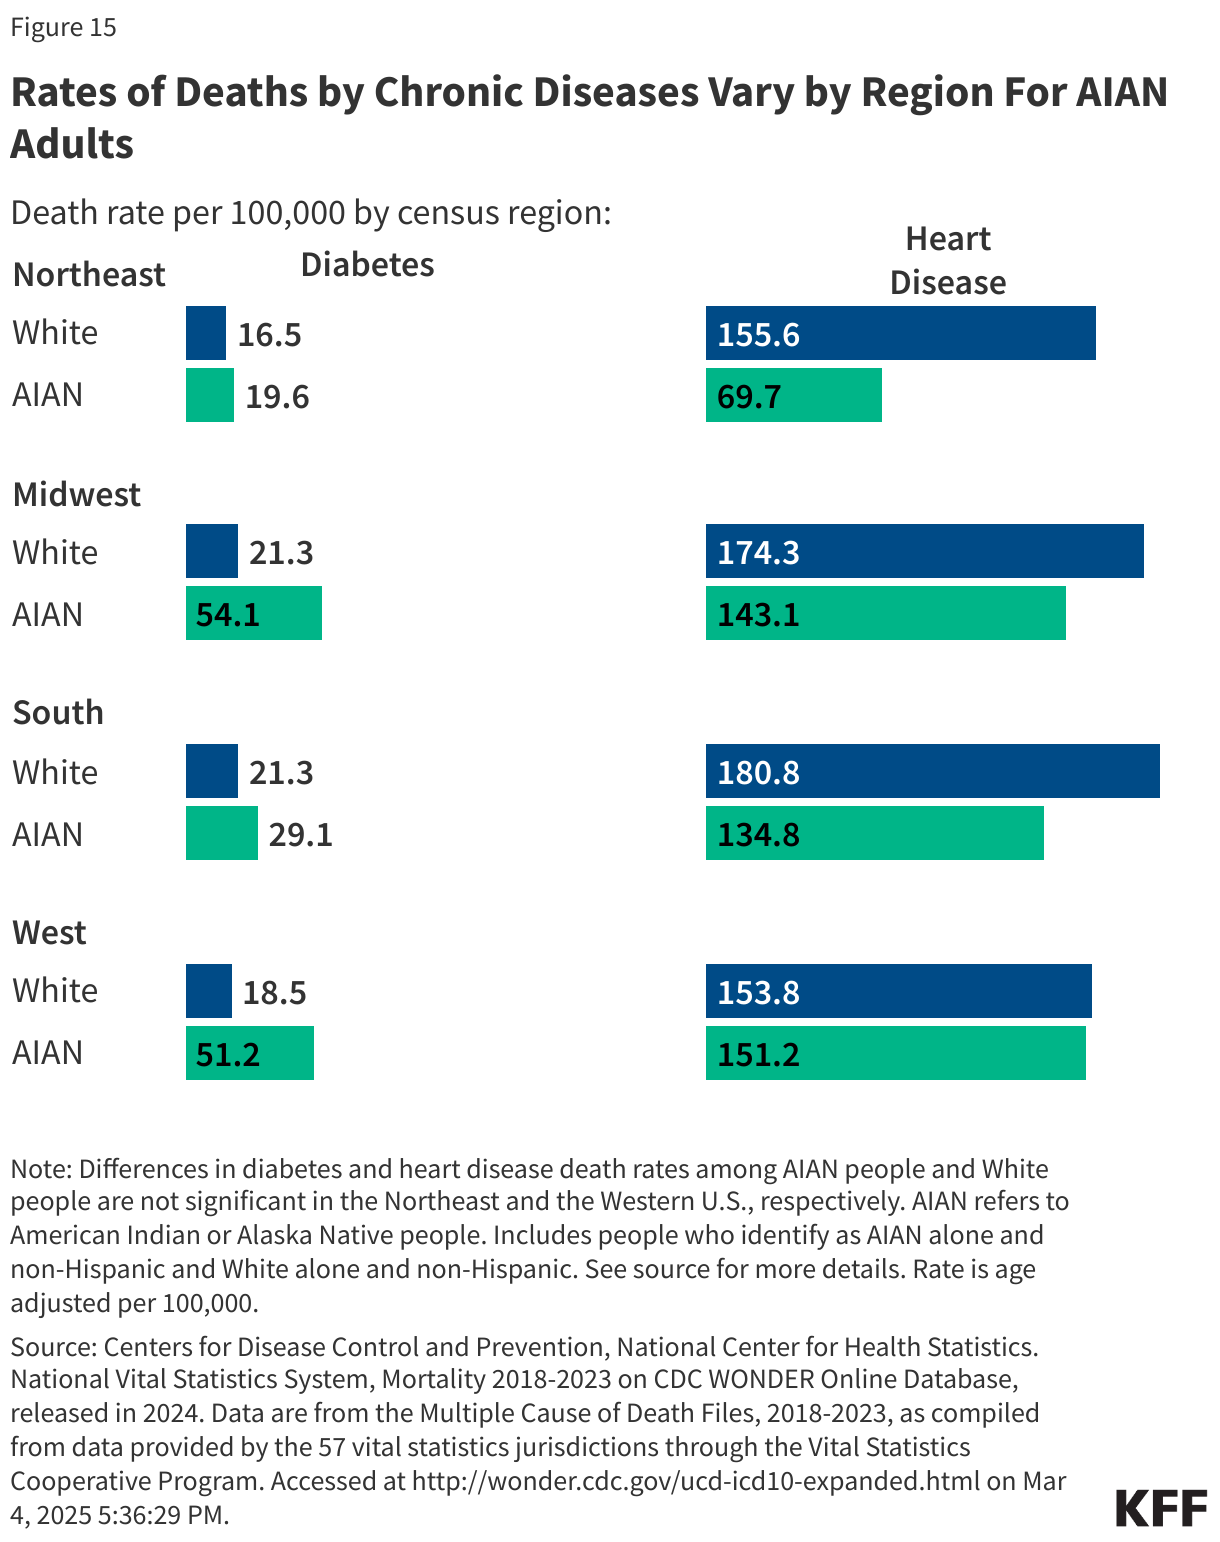
Rates of diabetes and heart disease mortality vary by census region among people who identify as AIAN alone. Geographically, among AIAN people, rates of death due to diabetes range from 19.6 per 100,000 in the Northeast to 54.1 per 100,000 in the Midwest. Heart disease deaths range from 69.7 per 100,000 in the Northeast to 151.2 per 100,000 in the Western U.S. (Figure 15). Regional differences in mortality could in part reflect differences in health coverage and access in each region. However, a range of other factors may contribute to regional differences, including environmental, lifestyle, and socioeconomic factors.
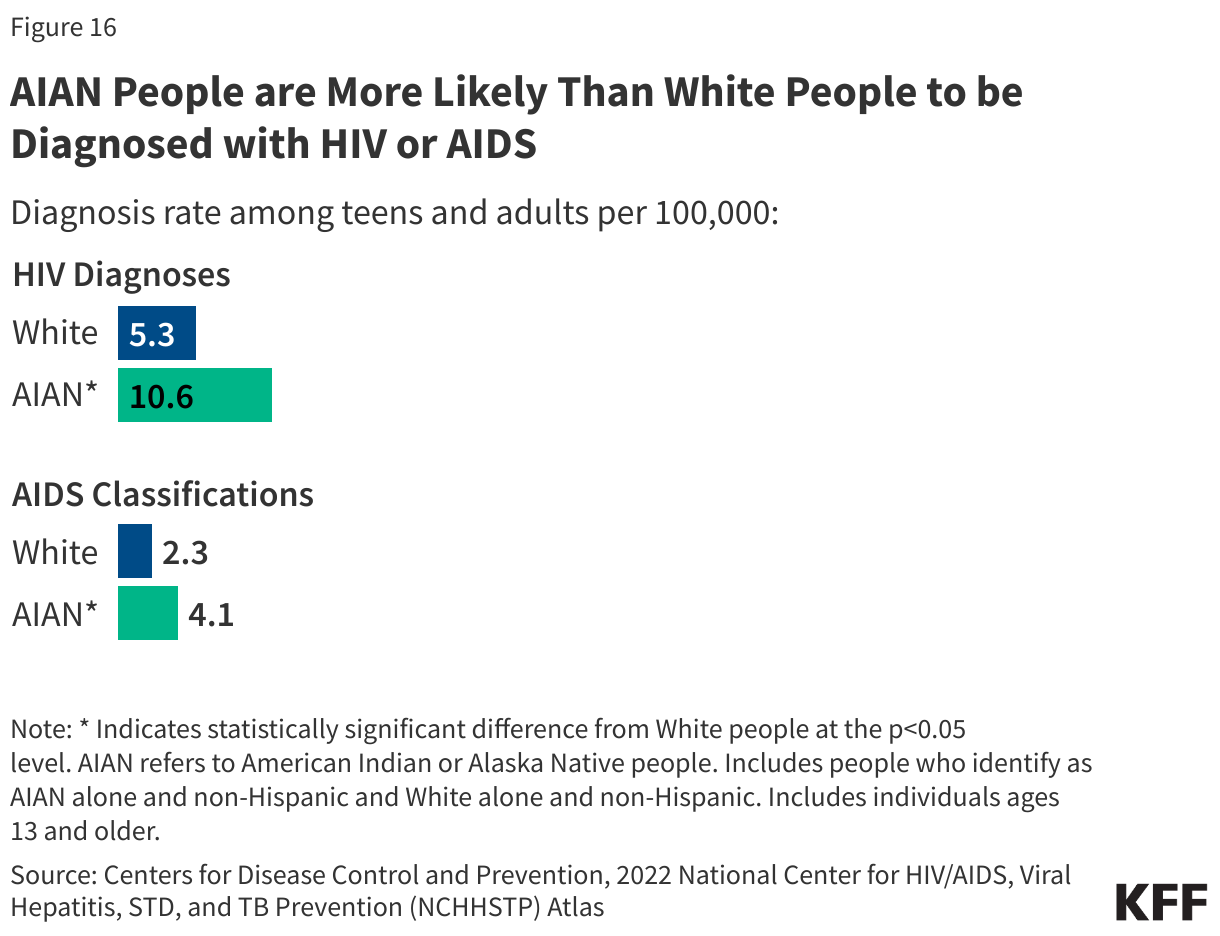
AIAN people are more likely than White people to be diagnosed with HIV or AIDS, the most advanced stage of HIV infection. In 2022, the HIV diagnosis rate for people who identify as AIAN alone was about two times higher than the rate for White people (10.6 vs. 5.3 per 100,000). Similar patterns are observed in AIDS classification rates, the most advanced stage of HIV, reflecting barriers to treatment. People who identify as AIAN alone have higher AIDS classification rates than White people (4.1 vs. 2.3 per 100,000) (Figure 16).
Cancer
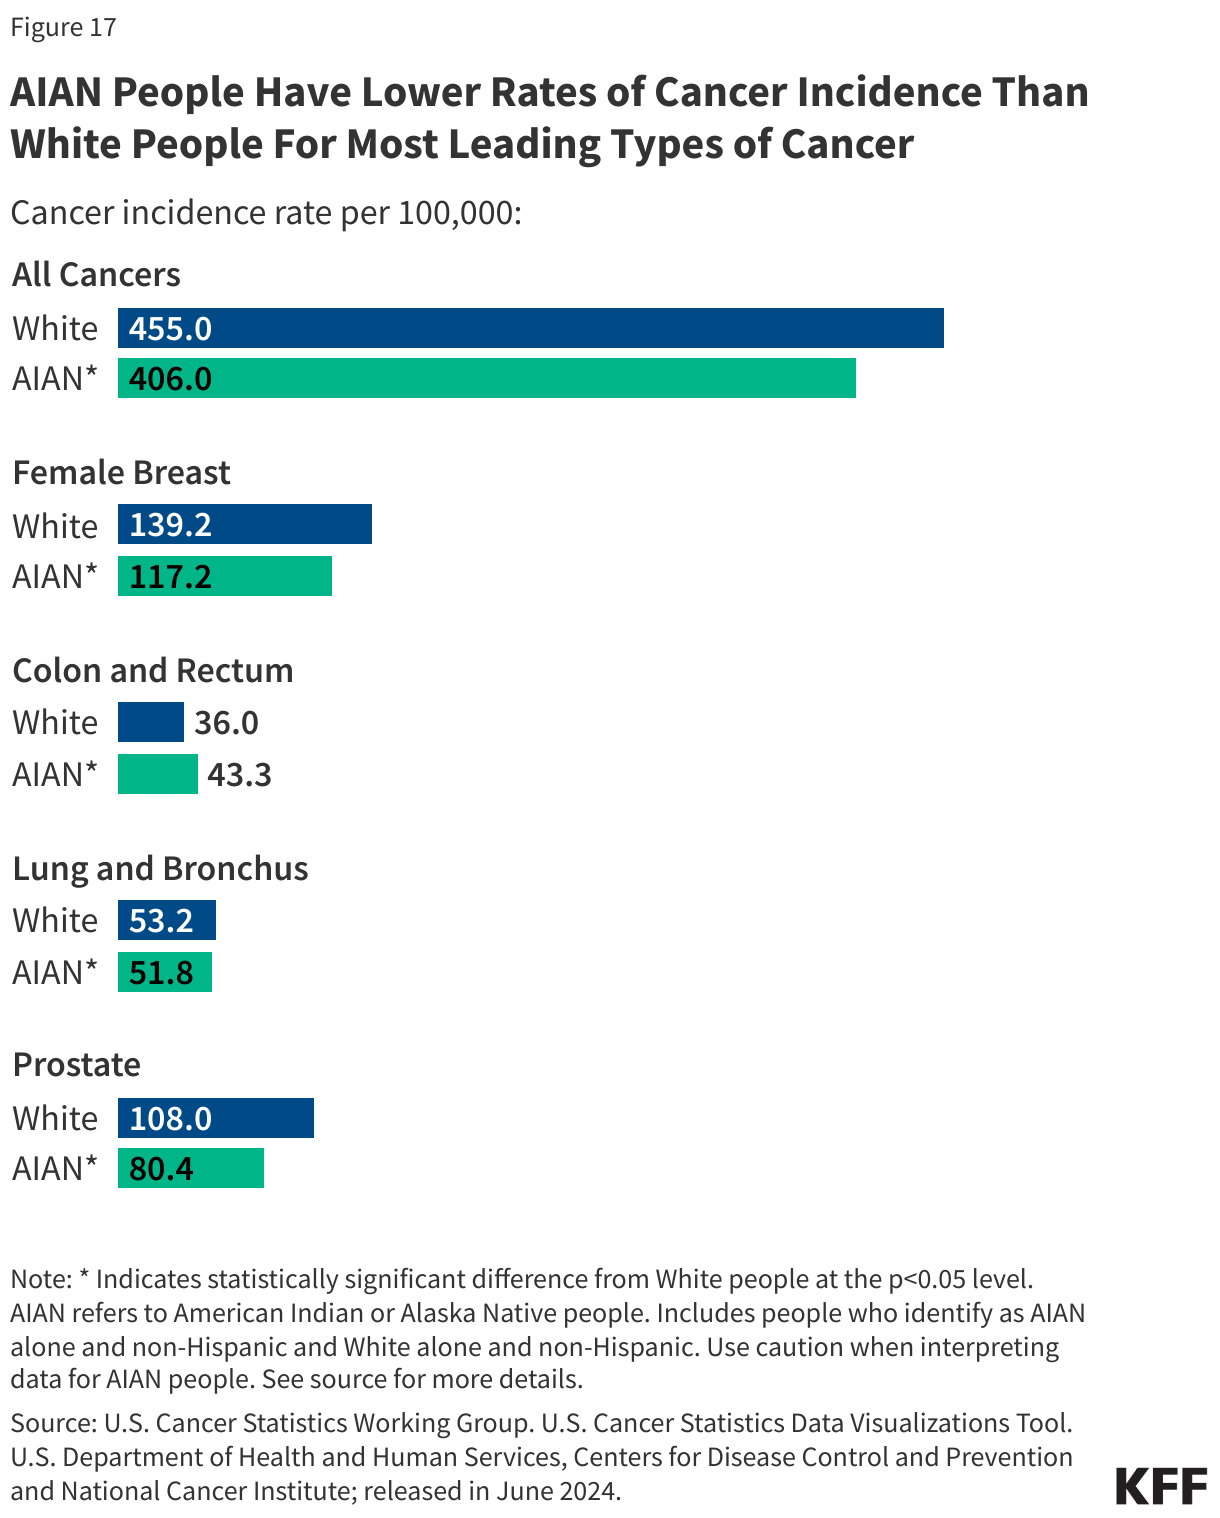
Differences in rates of cancer incidence are mixed between AIAN and White adults. People who identify as AIAN alone have lower rates of cancer incidence than White people overall, and across most leading types of cancer examined. However, AIAN people have higher incidence rates of colon and rectum cancer than White people (43.3 vs. 36.0 per 100,000) (Figure 17). Further, other data show that AIAN people have the highest rates of liver cancer incidence across racial and ethnic groups.
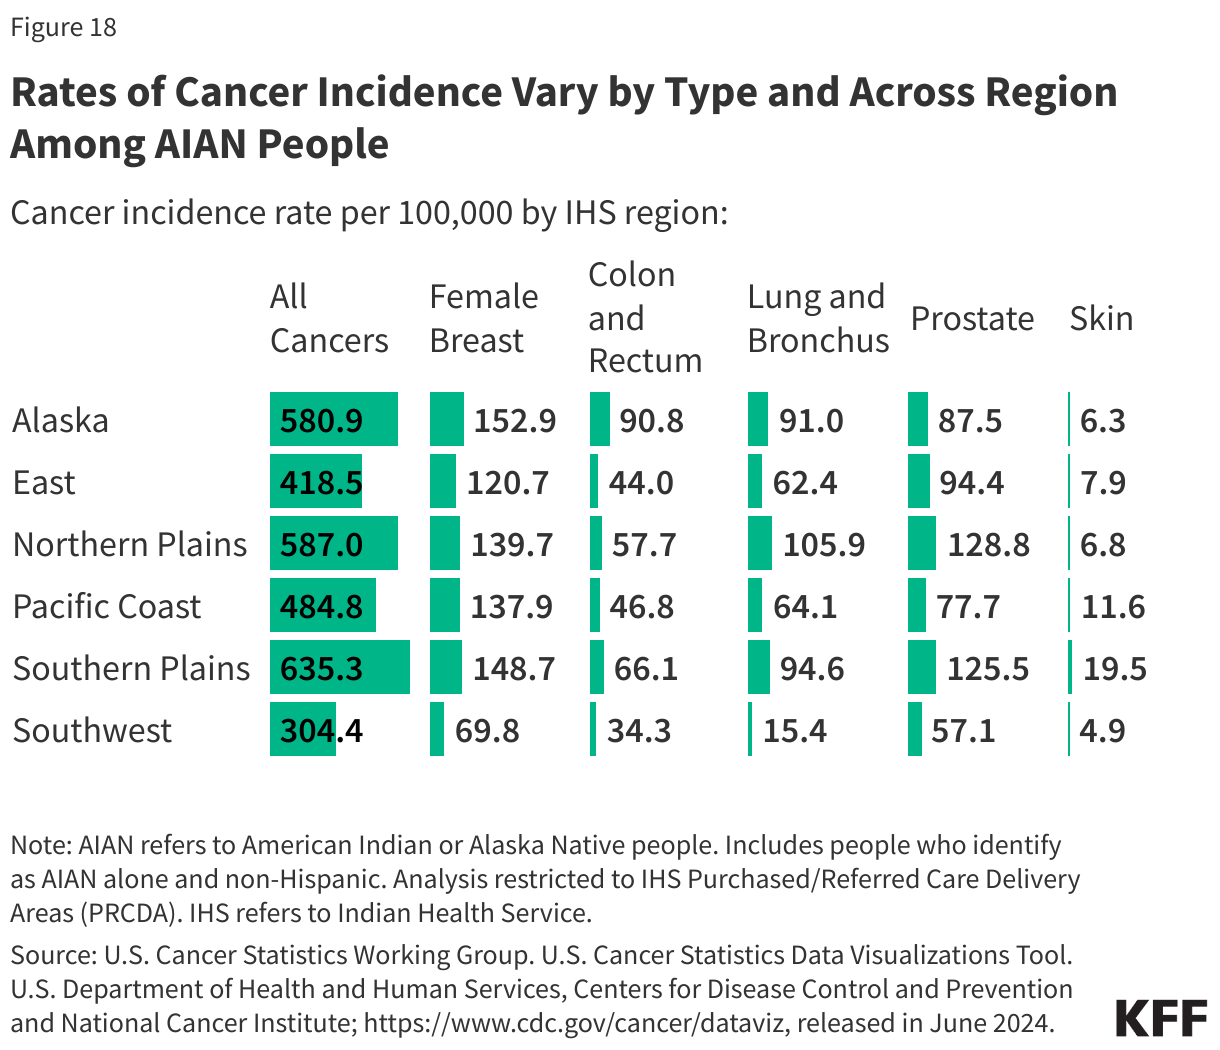
Cancer incidence rates among people who identify as AIAN alone vary across IHS regions. Rates of cancer incidence range from 304.4 per 100,000 in the Southwest to 635.3 per 100,000 in the Southern Plains (Figure 18). Rates of lung and bronchus, and prostate cancer are highest in the Northern Plains (105.9 and 128.8 per 100,000, respectively) and lowest in the Southwest (15.4 and 57.1 per 100,000, respectively). Alaska Native people have the highest colorectal cancer incidence and mortality rates in the world, which may in part be due to lower receipt of screening. This regional variation may reflect a variety of environmental, lifestyle, and socioeconomic factors.
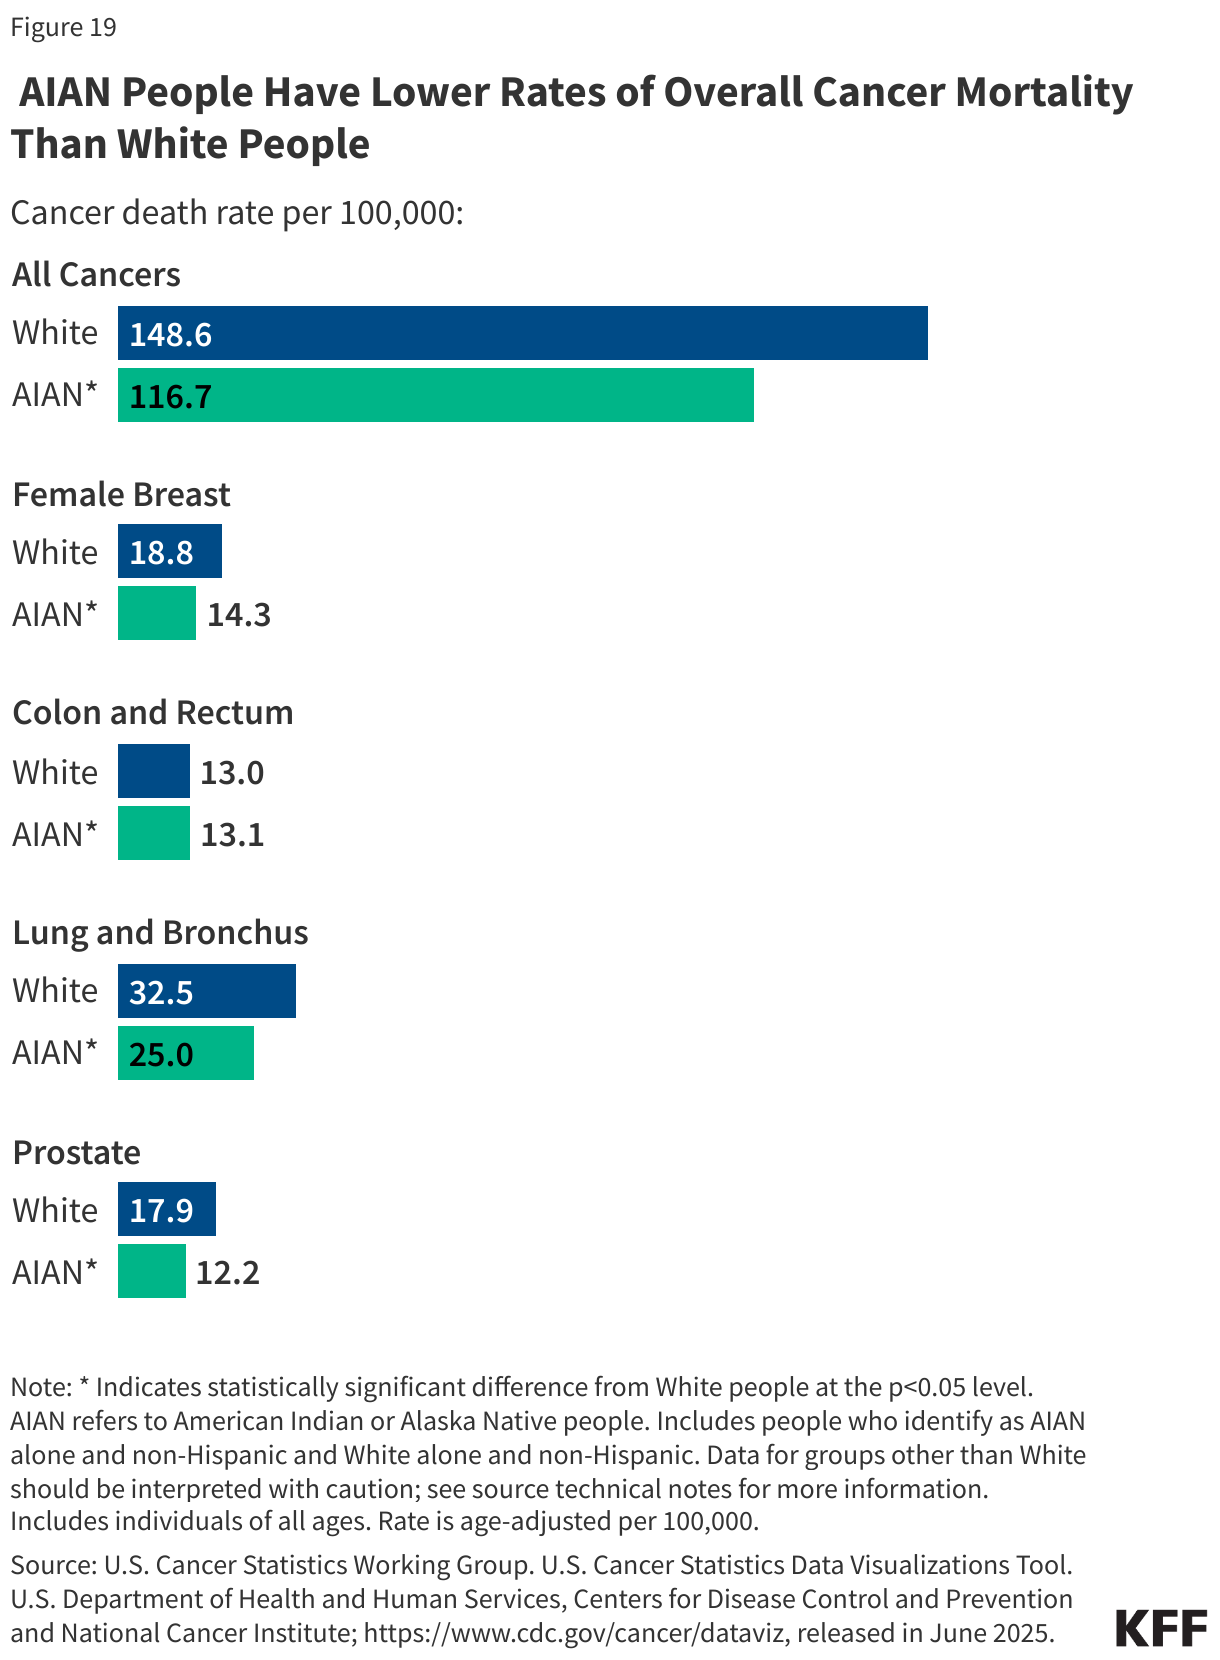
Consistent with their lower incidence rates, AIAN people have lower rates of cancer mortality than White people for all cancers as well as across most leading cancer types (Figure 19). However, as of 2023, people who identify as AIAN alone and White people have similar rates of death due to colon and rectum cancer (13.1 and 13.0 per 100,000, respectively).
Suicide and Substance Use Disorder
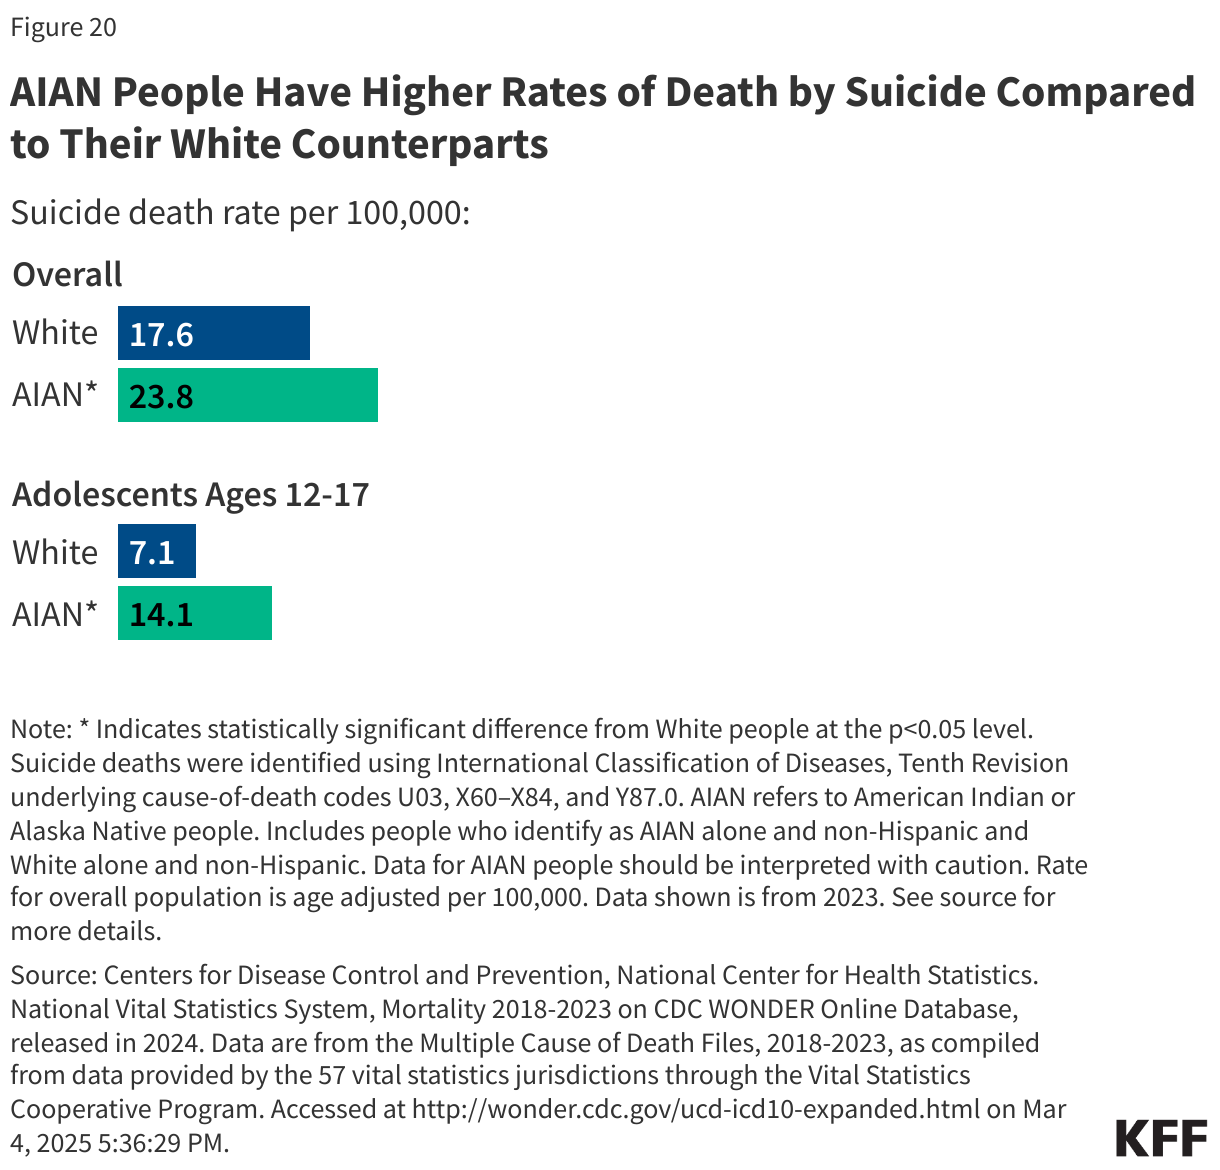
AIAN people have the highest rates of deaths by suicide across all racial and ethnic groups. In 2023, people who identify as AIAN alone have higher rates of deaths by suicide than White people (23.8 vs. 17.6 per 100,000) (Figure 20). Additionally, AIAN adolescents have the highest rates of deaths by suicide across all racial and ethnic groups. Research finds that suicide is the second leading cause of death for high school-aged AIAN adolescents. Rates of deaths by suicide increased by 139% for AIAN adolescent females and 71% for AIAN adolescent males between 1999 and 2017, however, recent data show that these rates declined between 2021 and 2023. Studies have shown that the high rates of suicide are associated with AIAN youths’ high likelihood of having adverse childhood experiences combined with historical intergenerational trauma as a result of colonization and structural discrimination.
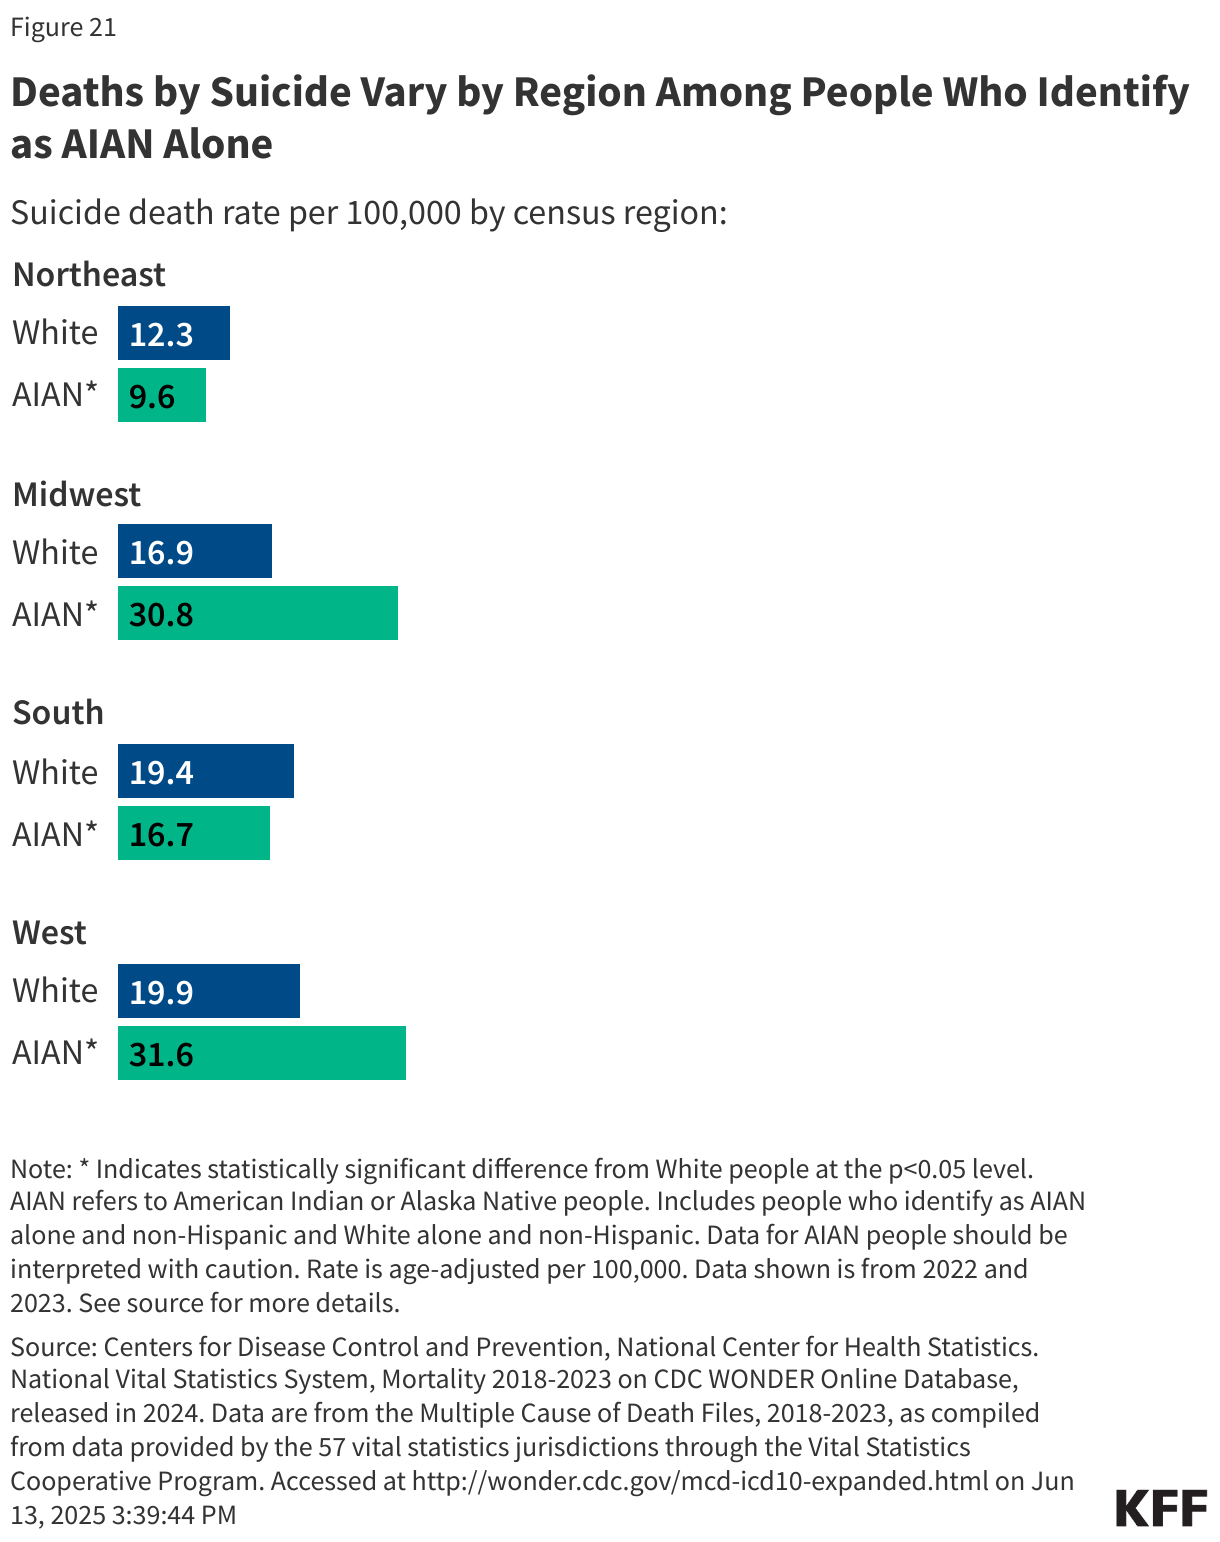
Deaths by suicide vary by region among people who identify as AIAN alone. AIAN people in the Western U.S. experience the highest rate of deaths by suicide (31.6 per 100,000), while AIAN people in the Northeast experience the lowest rate of deaths by suicide (9.6 per 100,000) (Figure 21). Deaths by suicide are higher among AIAN people than White people in all regions except the Southern U.S.
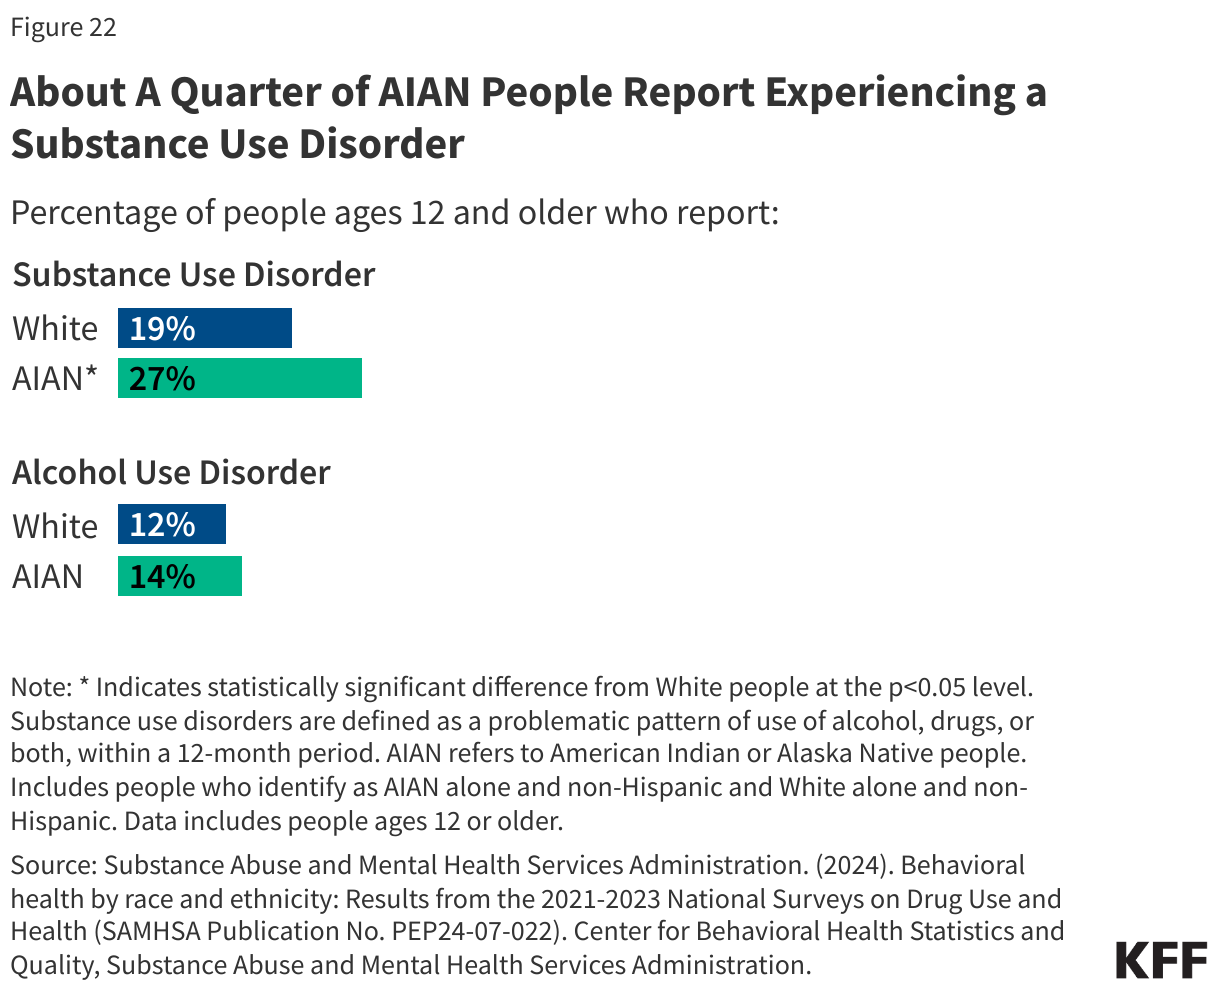
AIAN people report the highest prevalence of substance use disorder (SUD) in the past year compared with other racial and ethnic groups. AIAN people also experience the highest rates of drug overdose death, including the highest rates of opioid-related deaths in 2023. The high rates of opioid-related deaths likely reflect the low uptake of medication treatment services among AIAN people. Among those ages 12 years and older, over a quarter (27%) of people who identify as AIAN alone report experiencing substance use disorder in the past year, compared to 19% of White people (Figure 22). Similar shares of AIAN people (12%) and White people (14%) report experiencing alcohol use disorder.
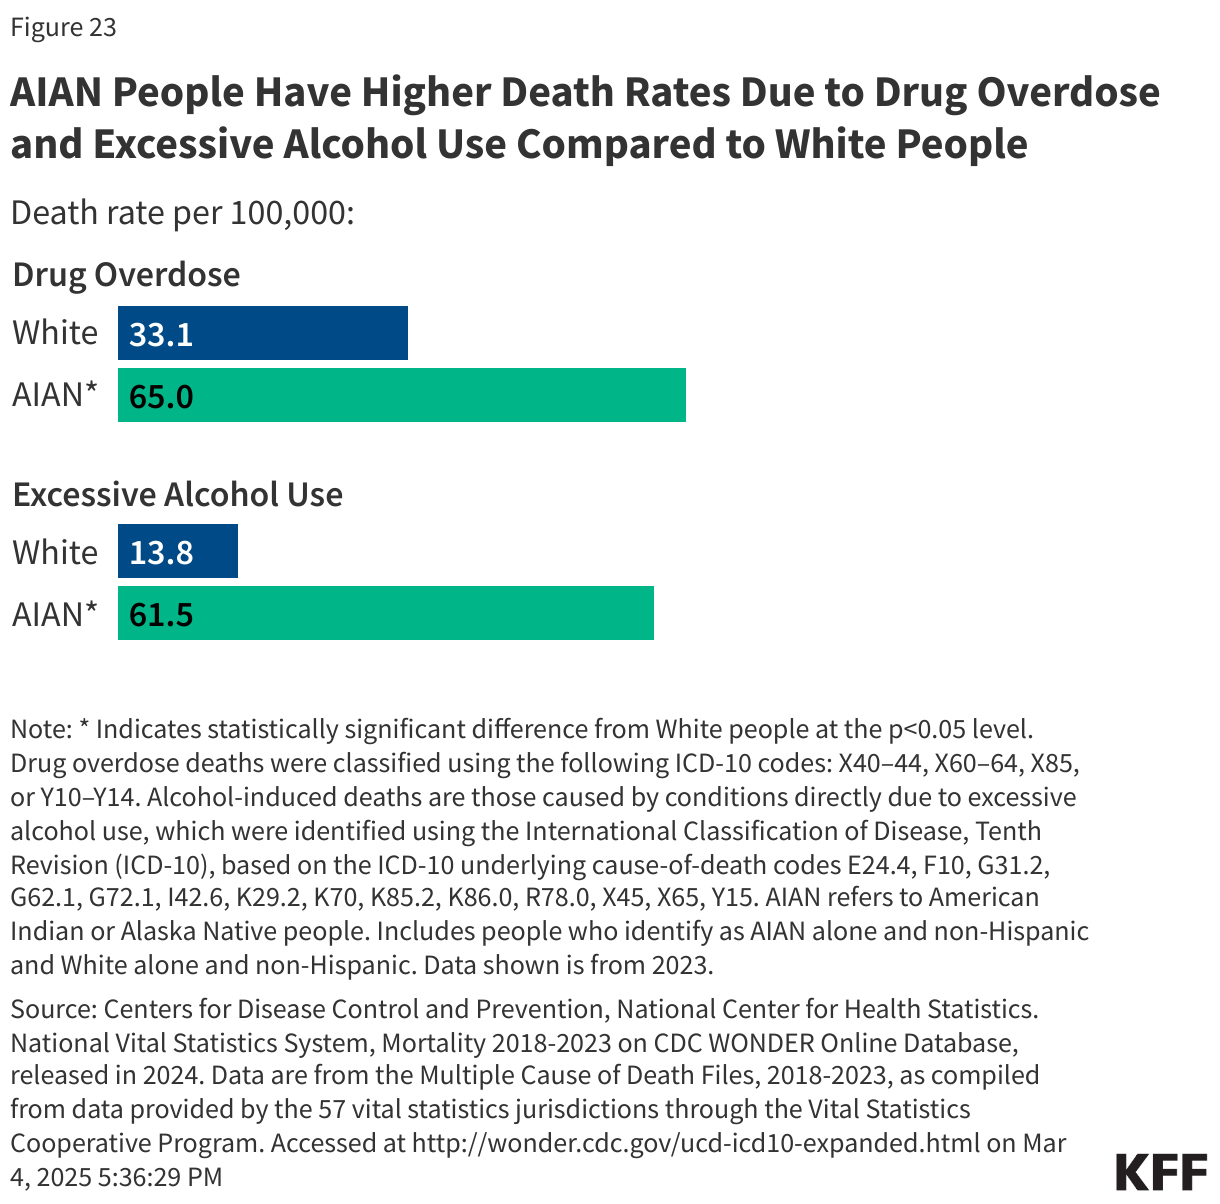
AIAN people are about twice as likely to die from a drug overdose compared to White people (65 vs. 33.1 per 100,000) in 2023 (Figure 23). Alcohol-induced deaths are also higher among people who identify as AIAN alone in 2023 compared to White people. AIAN people have the highest rate of alcohol-induced deaths and the fastest growing rate of alcohol-induced deaths compared to other racial and ethnic groups, nearly doubling in the past 10 years. Increases in alcohol deaths among AIAN people follow worsening trends in other areas related to behavioral health, where AIAN people have both the highest and fastest-growing rates of suicide and overall drug overdose deaths.