

-

Bradford Doolittle
From the standings to the league leaders to the scoreboard itself, numbers are narrative in baseball.
Each season is a little different and 2025 is no exception. Some numbers tell the story as it unfolds; others suggest where the game is and might be headed.
Here are a few numbers that are holding my attention as we approach the halfway point of the campaign.
.454
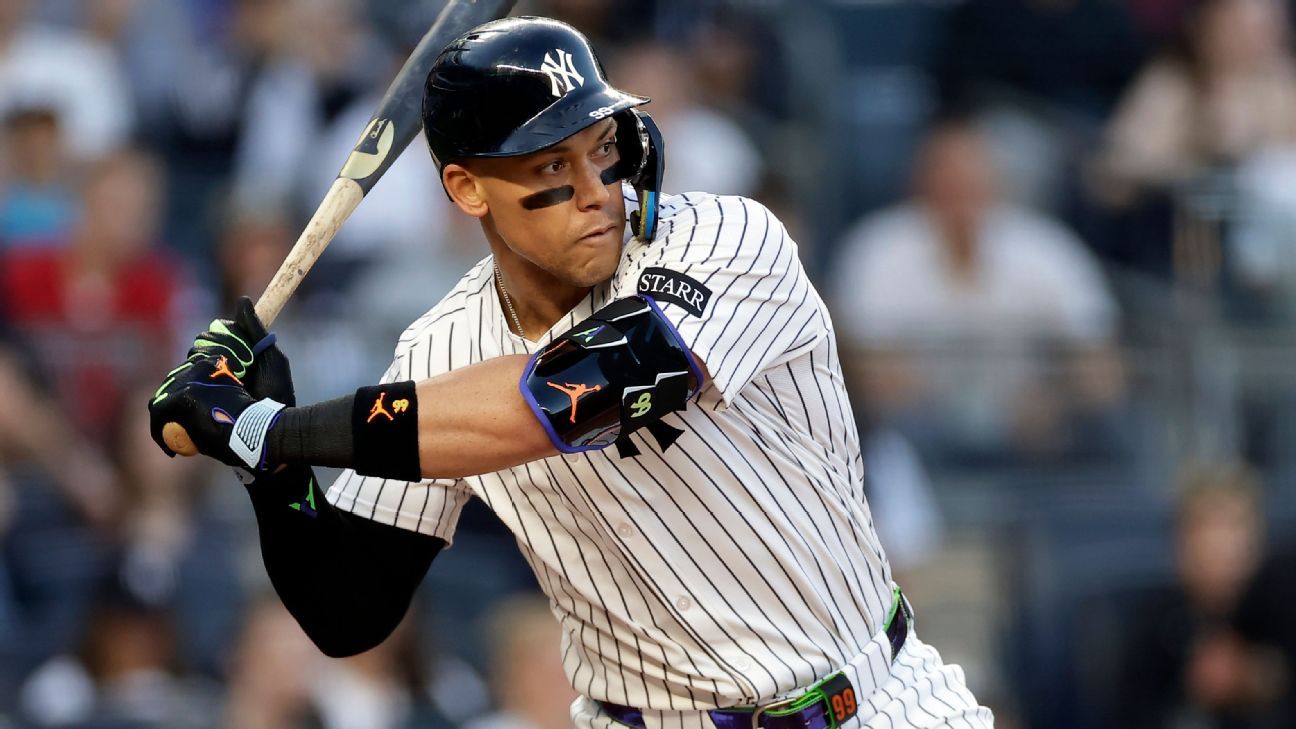
What the number is: Aaron Judge‘s batting average on balls in play
Why it’s important: Judge has reached that rarefied place few other hitters have: when a star batter becomes so lethal, debates emerge about whether it would be better to simply walk him every time he comes up.
The short answer to that is no — the math doesn’t check out — but that doesn’t mean Judge isn’t doing something that seemed all but unthinkable during his recent run of dominance: He’s gotten even better.
All of the usual indicators that have made Judge the game’s best hitter are in line with his recent standards. He’s on track to homer in more than 8% of his plate appearances for a fourth straight season. His strikeout rate is up a bit lately but is also comparable to his composite for the past few years.
The glaring difference is Judge’s batting average: .372. Even with a recent slump, he’s in position to challenge for the American League’s Triple Crown. That by itself is remarkable for a player who, at the age of 25 in 2017, homered 52 times but also had 208 strikeouts.
Judge’s average spike is in part because of a better whiff rate than his early years, but it’s mostly driven by that BABIP. He’s always been a high BABIP hitter — .352 for his career — simply because he hits the ball hard so often, but we’ve never seen anything like this.
This BABIP has a chance to be truly unprecedented. According to Baseball Reference’s Stathead, the all-time mark for BABIP by a qualifying AL or NL batter is Ty Cobb’s .443 mark in 1911. Judge is currently on pace to obliterate that record.
Also think about what kind of hitter Judge is — an awe-inspiring home run hitter. The BABIP leaderboard is dominated by deadball era players who excelled at a time when the game was all about batting average — Cobb, Shoeless Joe Jackson, Willie Keeler, Jesse Burkett. In the 1920s, a power hitter joined the upper tier of the stat: Babe Ruth.
Yet Ruth’s career high in BABIP was .423 (1923), nowhere close to where Judge is right now. We used to point to Judge’s feats and contextualize them by citing their historical proximity to Ruth. At the rate things are going, we might end up contextualizing Ruth for his proximity to Judge.
1.89
What the number is: Paul Skenes‘ ERA over his first 38 career starts
Why it’s important: It’s a fun exercise to take a player who is off to a fast career start and see how he ranks on some all-time leaderboard. Doing so might highlight his early accomplishments, but we still understand the point is limited. The player hasn’t gone through the ups and downs, injuries and eventual declines that accompany a baseball career.
Nevertheless, we’re going to highlight Skenes’ ERA this way because it’s just so astonishing. And not for nothing, 38 starts is a pretty good sample.
Ordinarily, ERA is limited when it comes to historical comparisons, because the league contexts that affect it have vacillated so wildly through baseball history. You don’t have to be a baseball analyst to understand why the 1.74 ERA that Pedro Martinez posted in the offense-intense 2000 season was very different than when Ron Guidry posted the same figure in pitching-friendly 1978, and even more different than when Tim Keefe landed there in 1888, when the rules were very different.
The remarkable thing about Skenes’ ERA is how it stands out historically, even if you don’t adjust it one iota for league, team or ballpark context. The current all-time leaderboard for career ERA, minimum 38 starts:
1. Ed Walsh (1.82)
2. (tie) Paul Skenes, Addie Joss (1.89)
You’ve got two Hall of Famers who flourished at the heights (lows?) of the deadball era … and Paul Skenes.
22%
What the number is: The overall MLB strikeout percentage
Why it’s important: Look, 22% is still a high strikeout rate on the historical scale. In each season from 1979 to 1981, for example, it was just 12.5%, and that’s when pitchers were still hitting in the National League. But it’s progress: Last year, the figure was 22.6% and we’re now down 1.2% from the full-season record set in 2021. (It was even higher in the shortened 2020 season.)
That much of a four-year decline from 2021 is certainly noteworthy in a category that has generally gone up relentlessly over the entirety of big league history. When the rate dropped off slightly from the shortened season, it ended a 15-year streak of annual increases.
When strikeouts are down, batting average generally goes up, and so it seems to be the case in 2025. The overall .245 mark is nothing to write home about, but it’s two points better than last season, and the number should go up, as the best batting average months are ahead of us.
The average is driven by the improved contact. League BABIP (.291) remains steady over last year, when it plummeted from the .297 mark in 2023. That turned out to be a temporary spike caused by the ban on extreme shifts, but defenses seem to have adjusted.
The game would be better if we could start to push that BABIP back toward .300. In absence of that, we’ll take a little more contact. So far in 2025, we’ve been getting it.
160
What the number is: Shohei Ohtani‘s runs scored pace
Why it’s important: Once again a big league pitcher, Ohtani continues to do unprecedented things at the plate as a Dodger. His stolen base numbers are down from 2024, when he put up MLB’s first 50/50 season, and now that he’s pitching again, we shouldn’t expect the thefts to accelerate. But Ohtani’s work on the bases is still off the charts.
According to Baseball Reference, Ohtani has scored 45% of the time when he reaches base, fourth in the majors. He’s also third in the NL in on-base percentage, behind only teammates Will Smith and Freddie Freeman, so he has had a lot of opportunities to score. Runs scored percentage doesn’t include tallies on homers, and he’s leading the NL in that category with 25.
Roll it all together and Ohtani is on pace to score 160 runs. That just doesn’t happen. The modern record is Ruth’s 177 from 1921. Ruth and Lou Gehrig both topped 160 runs twice — and that’s it. No one else has gotten there.
There’s more: Since World War II, only Ted Williams (150, 1949) and Jeff Bagwell (152, 2000) have reached even 150 runs scored. Ohtani might not post another 50/50 season, but that doesn’t mean he’s still not doing historic things at the plate.
And, yeah, he’s pitching again, too.
6.86%
What the number is: The percentage of stolen base opportunities resulting in attempts
Why it’s important: Teams are still sorting out how to optimize for the revamped stolen base context stemming from rule changes and the adoption of larger bases. After wading into heightened running games at first, we’re really seeing teams rev things up in 2025 — and there’s room for more growth.
SBA% is a formula that estimates the number of theft opportunities that arise and converts that to a rate based on the actual number of attempts. The 6.86% figure is up from 4.31% in 2021, a nadir for the division era. Last season, the rate was at 6.75%.
Caught stealing percentage is up, too — 22.6% of attempts — but while it’s the highest number since the rules were changed, it’s still the third-lowest mark on record. If we consider the accepted red flag level for caught stealing to be 25% — more than that, then teams are being too aggressive — that means teams have room to get even more bold.
As it is, we’ve seen 0.75 steals per game in 2025, the highest figure since 1990. This set of rule changes has been a positive.
39.4%
What the number is: The percentage of runs that have scored via homers
Why it’s important: This number is related to both the improved contact rate and the increased steal rate noted above, but it’s still worth calling attention to on its own. The 39.4 R/HR% is at its lowest since 2015.
In general, runs have been hard to come by in 2025, and it remains true that the easiest way to score a run is to simply jack the ball over a fence. Teams haven’t stopped trying to do that. But there has been an uptick in the diversity of offensive styles. That’s a good thing.
MLB has acknowledged that its own data on the performance of the baseballs this year indicates increased drag, making homers a little harder to come by.
Keep it up! The harder it is to homer, the craftier teams will have to be when it comes to scoring. During the 20-year period ending in 1993, R/HR% was around 29%. We’ve got more work to do, but at least the trend arrow is pointing the right direction.
61
What the number is: Cal Raleigh‘s home run pace
Why it’s important: Three players are on pace for at least 50 homers: Judge, Ohtani and, yes, the amazing Cal Raleigh.
Clearly, if Raleigh were to get to 61 homers, it would be one of the most remarkable longball seasons in baseball history. Not only because of the number, but also because he’s a Gold Glove catcher — more on that in a bit — and because Raleigh’s home park in Seattle is a brutal venue for offense.
There’s also this: Raleigh is a switch-hitter, and he has mashed with equal aplomb from both sides of the plate. Let’s keep dreaming on this 61-homer pace: Mickey Mantle’s 54 bombs in 1961 is the record for a switcher. Mantle, who also hit 52 in 1956, is the only switch-hitter ever to top 50.
But yes, Raleigh is a catcher, and he’s one of the best. Among primary catchers, the homer record is 48, set by Kansas City’s Salvador Perez in 2021. But Perez hit 15 of those homers while DHing. According to the Baseball Reference split finder, the record for homers by a catcher as a catcher is 42, set by Atlanta’s Javier Lopez in 2003.
So far, 25 of Raleigh’s 27 homers have come when he’s catching — a pace of 56.
42/51
What the number is: Pete Crow-Armstrong‘s homer and steal paces
Why it’s important: The Cubs’ offense has been one of the breakout units in the sport this season. If we told you back in March that this would be the case, you’d assume the attack had been ignited by the addition of Kyle Tucker.
Tucker has been every bit as good as the Cubs hoped, but the avatar for the Cubs’ offensive leap has been the amazing Crow-Armstrong. Again, let’s adopt that back-in-March mindset. The default notion then was that if PCA could hit just well enough to stay in the lineup, his defense and baserunning would be a boon to the Cubs’ roster.
Indeed, Crow-Armstrong has been an impact performer in the field and on the basepaths. He’s also started pulling, launching and mashing the ball at elite levels, resulting in 19 dingers to date, with the homers coming at more than twice the rate as in his rookie season.
For now, Crow-Armstrong is on pace to become the Cubs’ first-ever 40/40 player. He’d also be just the seventh player ever to do it, period. But it’s becoming a thing. If PCA (or someone else — keep an eye on Elly De La Cruz) gets there, it would be the third straight season it’s happened, following Ronald Acuna Jr. and Ohtani.
76
What the number is: The number of starting pitchers on pace for at least 162 innings pitched
Why it’s important: Maybe I’m being a little pie-eyed here, because I long for the return of the preeminence of starting pitching. Still, there are 76 pitchers on pace to qualify for the ERA title. This number is subject to rapid change due to a sudden spate of pitching injuries. But perhaps other pitchers will pick up the pace a little and join the club if that happens.
For now, let’s stick with the pace of 76. Last season, 58 pitchers qualified for the ERA title, up from 44 in 2023. The last time we were in the 70s was 2016. The record was set in 1998, when there were 96.
We’re a long way from the days of Bob Gibson and Sandy Koufax, and complete games aren’t going to make a comeback any time soon. Still, it seems like teams are getting a little more out of their core rotation pitchers, which is a step in the right direction.
126
What the number is: The Colorado Rockies‘ loss pace
Why it’s important: If the Rockies break the record set by the Chicago White Sox just last season, MLB might have to start looking into why baseball’s worst teams have suddenly become so wretched. This isn’t Mizzou in the SEC (it’s a dig at my own school, so it’s OK), it’s the major leagues. Baseball teams simply aren’t supposed to lose this often.
There are so many amazing facts about these Rockies already. They are last in runs per game and runs allowed per game. That might seem like a no-brainer given their record, but lest we forget where the Rockies play their home games. A Colorado team hitting with wiffleball bats ought to escape the MLB cellar in scoring.
The Rockies are also on pace to be outscored by 437 runs. Yeah, that’s not good. The modern era record for worst run differential is minus-349, set by the 1932 Red Sox. I mean, I keep putting the numbers into the calculator because it doesn’t seem possible. Colorado has been outscored by 197 runs in 73 games. That’s 2.7 runs per game. Over 162 games, that calculates to 437 runs.
They really have been that bad. There have now been 2,706 teams that have played since 1901. That minus-197 differential, if it remained status quo, would rank 144th on the worst-ever list. And we’ve still got almost two weeks left in June.
12.2
What the number is: Judge’s bWAR pace
Why it’s important: We bookend our numbers tour with another stop at Mount Judge, because he’s just that unbelievable.
The real number here is 10 — as in a 10-WAR season, which would be Judge’s third. Only 13 players have ever had three or more 10-WAR seasons, and the list is awfully impressive:
10: Babe Ruth
8: Walter Johnson
6: Rogers Hornsby, Willie Mays
4: Christy Mathewson
3: Grover Alexander, Barry Bonds, Ty Cobb, Bob Gibson, Lefty Grove, Mickey Mantle, Ed Walsh, Ted Williams
The only hitters to do it are Ruth, Hornsby, Mays, Bonds, Cobb, Mantle and Williams. More lofty company. Judge, who had 10.8 bWAR last season, would be just the ninth hitter to do it in consecutive seasons. The others: Ruth, Bonds, Carl Yastrzemski, Mantle, Hornsby, Williams, Cobb and Mays.