


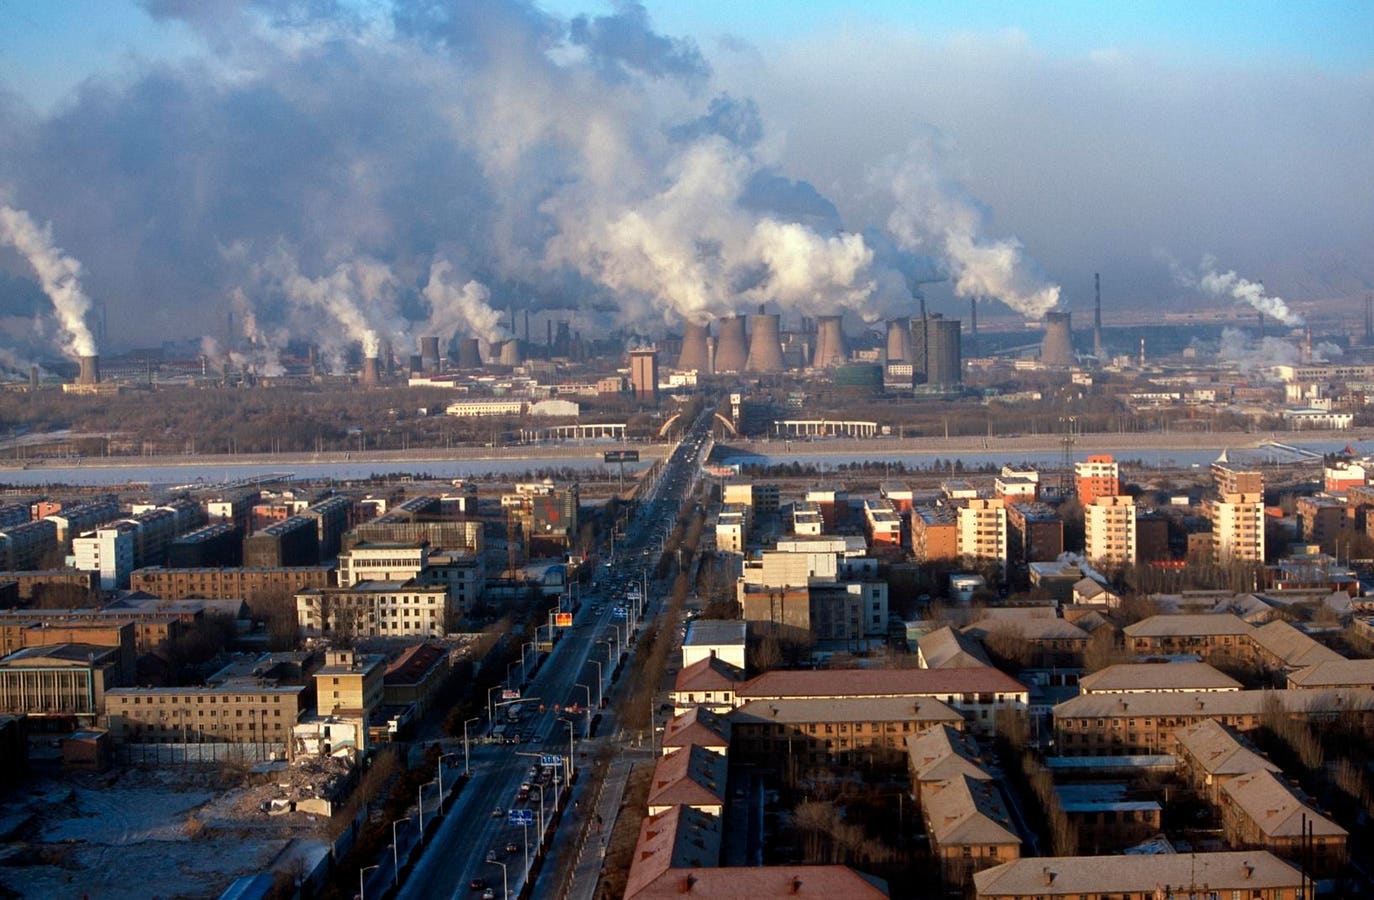
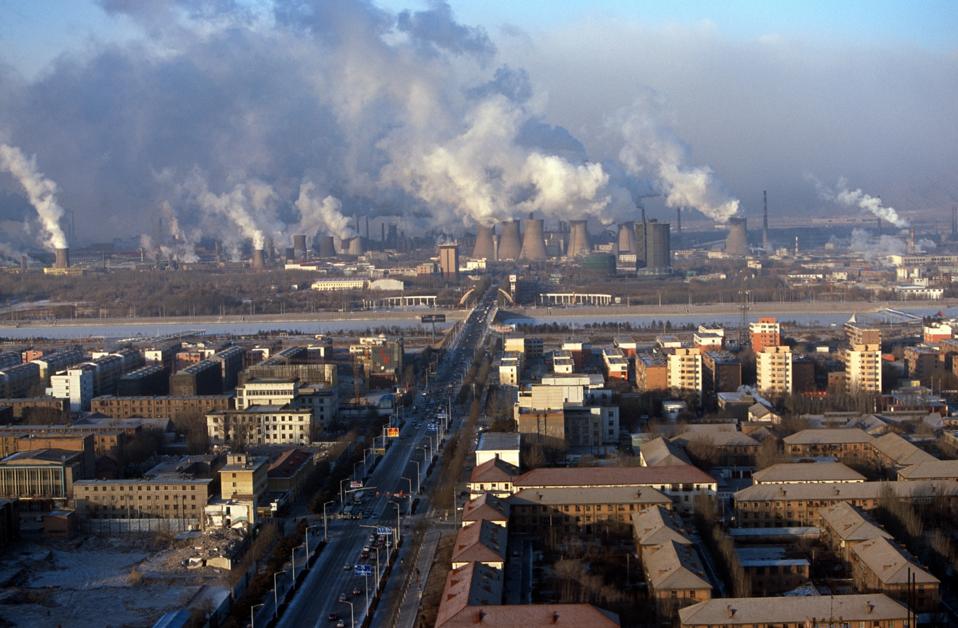
The Bao Steel mill in the morning, in Baotou, Inner Mongolia, China. Baotou is an excellent example … More
In late June the Energy Institute (EI) released the 2025 Statistical Review of World Energy, which was published previously for more than 70 years by BP.
Here is the link to the full 2025 Statistical Review of World Energy.
The Review confirmed that a troubling trend continues. Despite historic investments in renewables and net-zero pledges from nearly every major economy, global carbon emissions hit a record high in 2024. This article is the first in a series breaking down the key findings—and what they mean for the global energy sector.
Defining Carbon Emissions: What’s Included and Why It Matters
The Review breaks down carbon emissions into several categories, but the most comprehensive metric is total carbon dioxide equivalents (CO₂-equivalent emissions). This includes emissions from energy use, flaring, industrial processes, and methane associated with fossil fuel production, transportation, and distribution. As defined in the Review, CO₂-equivalent emissions represent the sum of carbon dioxide from fossil fuels, flaring, and industrial processes—plus methane emissions converted into their carbon dioxide equivalent.
This approach provides a fuller picture of each country’s contribution to atmospheric carbon levels. While land use changes like deforestation are not included, the inclusion of methane—a far more potent greenhouse gas than CO₂—makes this a more accurate measure of atmospheric impact.
Global Emissions Rise Again Despite Renewable Growth
Global carbon emissions hit a new all-time high in 2024, reaching 40.8 billion metric tons of CO₂-equivalent emissions. That’s up from 40.3 billion metric tons in 2023—an increase of 0.5 billion tons from the previous year, despite record investments in renewables and aggressive net-zero pledges from countries and corporations alike. The growth trend has continued at a relatively consistent rate since 2021.
Global CO2-Equivalent Emissions 1990-2024.
Over the past decade, global emissions have increased by nearly 1% per year on average, despite a growing list of international climate pledges. Although 2024 saw numerous headlines highlighting record growth in wind and solar—topics I’ll explore in upcoming articles—the emissions data tells a clear story: clean energy is expanding, but not fast enough to keep up with rising global energy demand.
Breaking Down the Big Three
The three largest carbon emitters in the world are China, the U.S., and India. Together, they account for over half of all global emissions. However, they have taken very different paths over the past few decades.
The Top Three CO2-Equivalent Emitters in 2024.
Despite a 37% increase in population over the period, U.S. carbon emissions in 2024 were lower than they were in 1990. Over the past decade, they’ve declined at an average annual rate of 1.0%. No country has reduced its carbon output more this century. Since 2000, U.S. emissions have fallen by 913 million metric tons—far surpassing second-place Germany, which saw a 292 million metric ton decline. While it’s true that the U.S. started from a higher emissions baseline, the scale of the reduction remains a significant achievement.
The most significant reduction in U.S. carbon emissions began around 2007, driven by two key shifts: the shale gas boom, which made natural gas cheaper and led utilities to switch away from coal; and the rapid growth of renewable energy, which chipped away further at coal’s dominance in the power sector.
In contrast, China’s carbon emissions have quintupled since 1990, rising by a staggering 8.8 billion metric tons since 2000 alone. In 2024, China emitted approximately 12.5 billion metric tons of CO₂—nearly 31% of the global total—more than the combined emissions of North America and Europe.
Despite being the global leader in solar and wind deployment, China is also the world’s largest consumer of coal. That contradiction—leading the clean energy buildout while still relying heavily on fossil fuels—helps explain why global carbon emissions continue to rise, even as renewables grow at record rates.
India’s emissions have also quintupled since 1990, with an increase of 2.2 billion metric tons since 2000—second only to China in absolute growth. In 2024, India emitted 3.3 billion metric tons, up 24% over the past decade.
India’s rising emissions are closely tied to economic development. As millions move out of poverty and into the middle class, energy demand increases. Much of that demand is still met by fossil fuels. India’s situation reflects the biggest challenge of the global energy transition: how to decarbonize while still expanding access to affordable energy.
Global Disparities
A regional view of the data reveals deeper structural imbalances. Over the past decade:
- Africa saw emissions jump by 25%.
- The Middle East’s emissions rose by 15%.
- The Asia-Pacific region, which includes China and India, added over 9%.
- Even South and Central America, often overlooked in these discussions, recorded a 9.3% increase.
In addition to North America, Europe showed a clear decline in emissions, which fell an average of 1.4% per year over the decade. The European Union’s emissions fell to 3.7 billion metric tons in 2024, down 15% from a decade earlier. Countries like Germany and the UK continue to make strong progress through a combination of policy, electrification, and energy efficiency.
But that success is uneven. In Eastern and Southern Europe, emissions are flat or even rising, and economic pressures have delayed some planned coal phase-outs. While Europe is often heralded as a climate leader, its internal divisions show how difficult it is to maintain momentum across a diverse bloc of nations.
These trends reflect varying levels of policy ambition, but also where population and economic growth are occurring. Much of the world’s energy demand growth is from countries that are still building basic infrastructure, expanding transportation networks, increasing industrial output, and expanding the middle class.
Final Thoughts: More Clean Energy, But Not Enough Subtraction
The data suggest that the much-hyped energy transition is still happening too slowly to halt emissions growth. Wind and solar are scaling, but they’re not yet replacing fossil fuels at the level needed to reduce total emissions.
We’re adding clean energy to the mix, but we’re not yet subtracting fossil energy. That’s why global emissions continue to rise, even as headlines trumpet climate breakthroughs. Until global demand growth levels off—or renewables begin displacing fossil fuels at scale—emissions are likely to keep climbing.
Next in this series: A closer look at the carbon productivity of top emitters and what per capita data reveals about global differences in emissions and energy use.
