


Close to 70 million people ages 65 and older and younger people with long-term disabilities receive their health insurance coverage through the federal Medicare program. While overall satisfaction with the program is high, paying for health care services can prove challenging for Medicare beneficiaries. In 2023, more than one-third (36%) of beneficiaries said they had delayed or gone without a visit to the doctor’s office, vision services, hearing services, prescription drugs or dental care in the past year because of the cost. Medicare households also spend a larger share of their total budgets on health care than non-Medicare households, and are more likely to need expensive long-term services and supports over an extended period of time, which are not covered by Medicare.
The cost of health care may become even more burdensome for Medicare beneficiaries in the coming years. A recent KFF analysis found that 7 million Medicare beneficiaries spent more than 10% of their annual income on Part B premiums alone in 2024, a number that may grow over the next decade if Part B premiums grow faster than income. Part B premiums are projected to nearly double between 2024 and 2034, from $2,100 per year to more than $4,000 per year. While people with relatively low incomes and limited financial resources can qualify for financial assistance with Medicare premiums and cost sharing through the Medicare Savings Programs, many beneficiaries with modest incomes do not qualify for this assistance, because their income or savings exceed the maximum amount. Other eligible beneficiaries may not receive these benefits because they don’t know about them or find the application process too challenging. In addition, provisions in the GOP’s recently enacted tax cut and spending law are expected to make it more difficult for eligible low-income Medicare beneficiaries to enroll in these programs, which is estimated to reduce the number of people receiving this coverage by 1.3 million beneficiaries.
To understand the financial resources available to people with Medicare that can be used to cover their health care costs, this brief examines the income, assets, and home equity of Medicare beneficiaries, overall and by age, race and ethnicity, and gender, using data derived from the Dynamic Simulation of Income Model (DYNASIM) for 2024. Due to data limitations, estimates for beneficiaries in some racial and ethnic groups, including Asian, American Indian and Alaska Native, and Native Hawaiian or Other Pacific Islander beneficiaries, as well as beneficiaries who identify as two or more races, are unavailable (see Methods for additional details on the model).
This analysis highlights that a large share of Medicare beneficiaries live on relatively low incomes and have modest financial resources to draw upon if they need to cover costly medical care or long-term services and supports, with notable differences by age, race and ethnicity, and gender. For example:
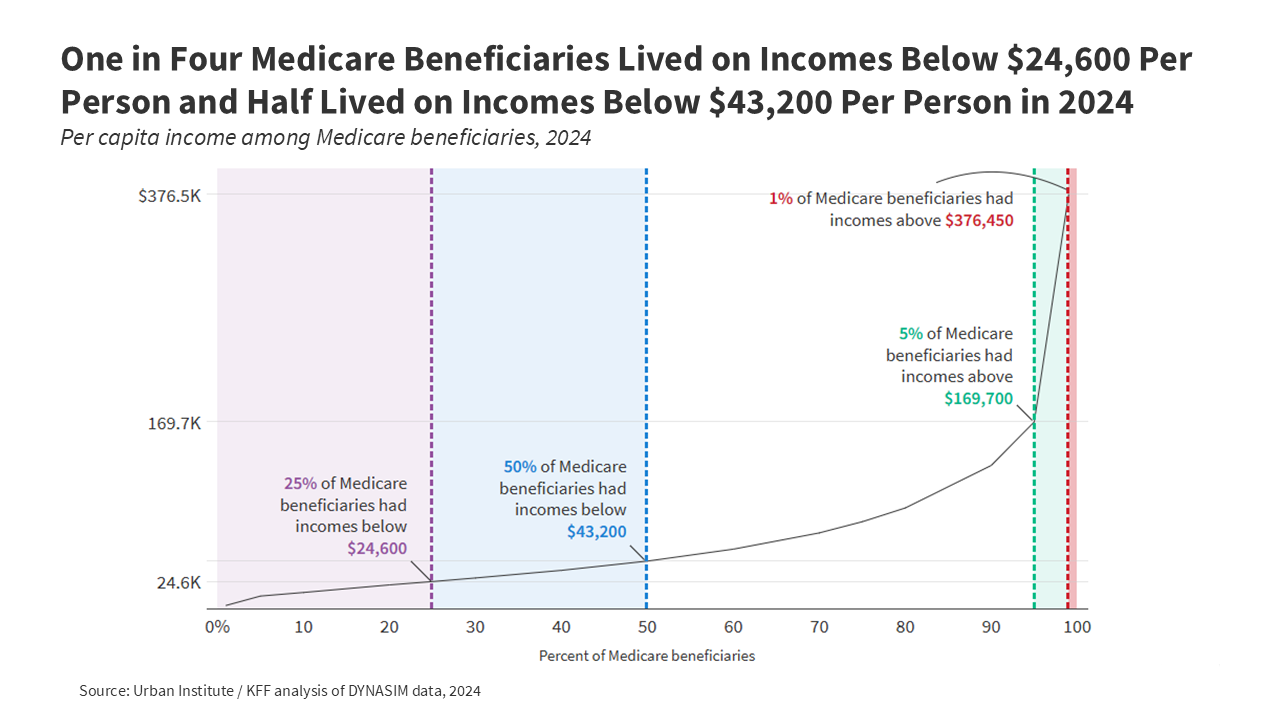
- One in four Medicare beneficiaries – 16.5 million people with Medicare – lived on incomes below $24,600 per person in 2024. Half (32.9 million) of all Medicare beneficiaries lived on incomes below $43,200 per person. At the upper end of the income spectrum, the top 5% (3.3 million) of Medicare beneficiaries lived on incomes above $169,700 per person.
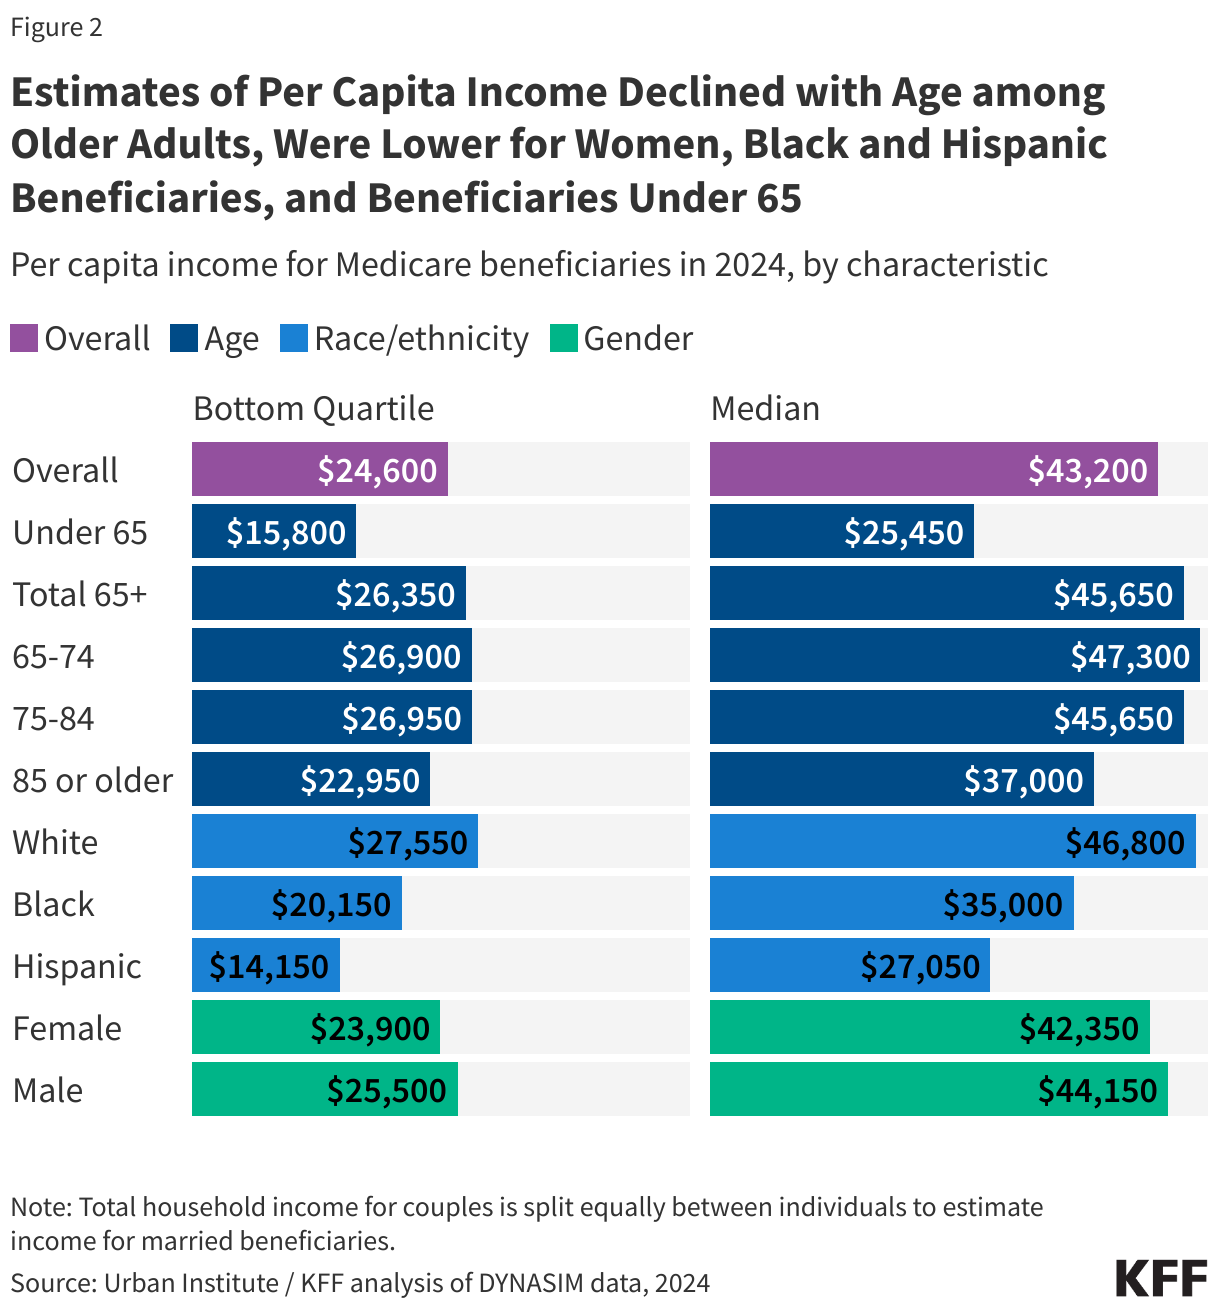
- One in four Medicare beneficiaries had savings below $18,950 per person in 2024, while half had savings below $110,100 per person. At the higher end of the savings distribution, the top 5% of Medicare beneficiaries had savings above $1.7 million per person.
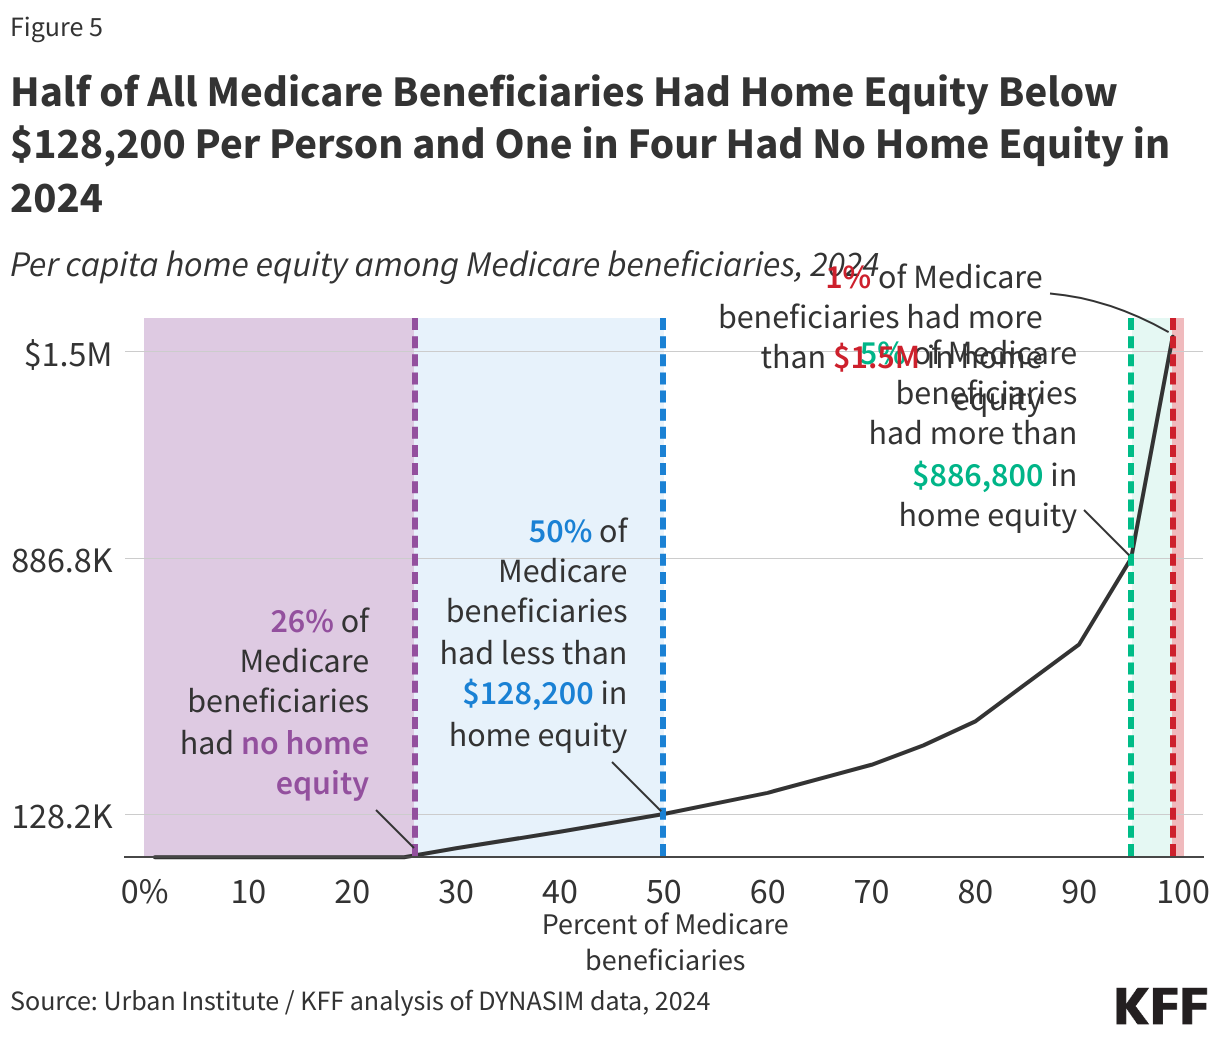
- One in four Medicare beneficiaries had no home equity at all in 2024, while half of all Medicare beneficiaries had home equity below $128,200 per person. The top 5% of Medicare beneficiaries had home equity above $886,800 per person.
- Per person estimates of income and savings varied by characteristic and were generally lower for beneficiaries ages 85 and older than for beneficiaries ages 65 to 84, lower for women than men, and lower for Black and Hispanic beneficiaries than White beneficiaries. Income and savings were also lower for beneficiaries under 65 with long-term disabilities than those ages 65 and older.
- Nearly half of all Black and Hispanic beneficiaries had no home equity, and roughly one in five Black and Hispanic beneficiaries had no savings or were in debt, compared to one in five White beneficiaries with no home equity, and fewer than one in ten White beneficiaries with no savings or in debt.
Income among Medicare Beneficiaries
In 2024, one in four Medicare beneficiaries, or 16.5 million people with Medicare, lived on incomes below $24,600 per person. Half of all Medicare beneficiaries, or 32.9 million people with Medicare, had incomes below $43,200 per person (Figure 1). At the higher end of the income distribution, the top five percent of Medicare beneficiaries (3.3 million) had incomes above $169,700 per person, including the top one percent (0.7 million) whose incomes exceeded $376,450 per person.
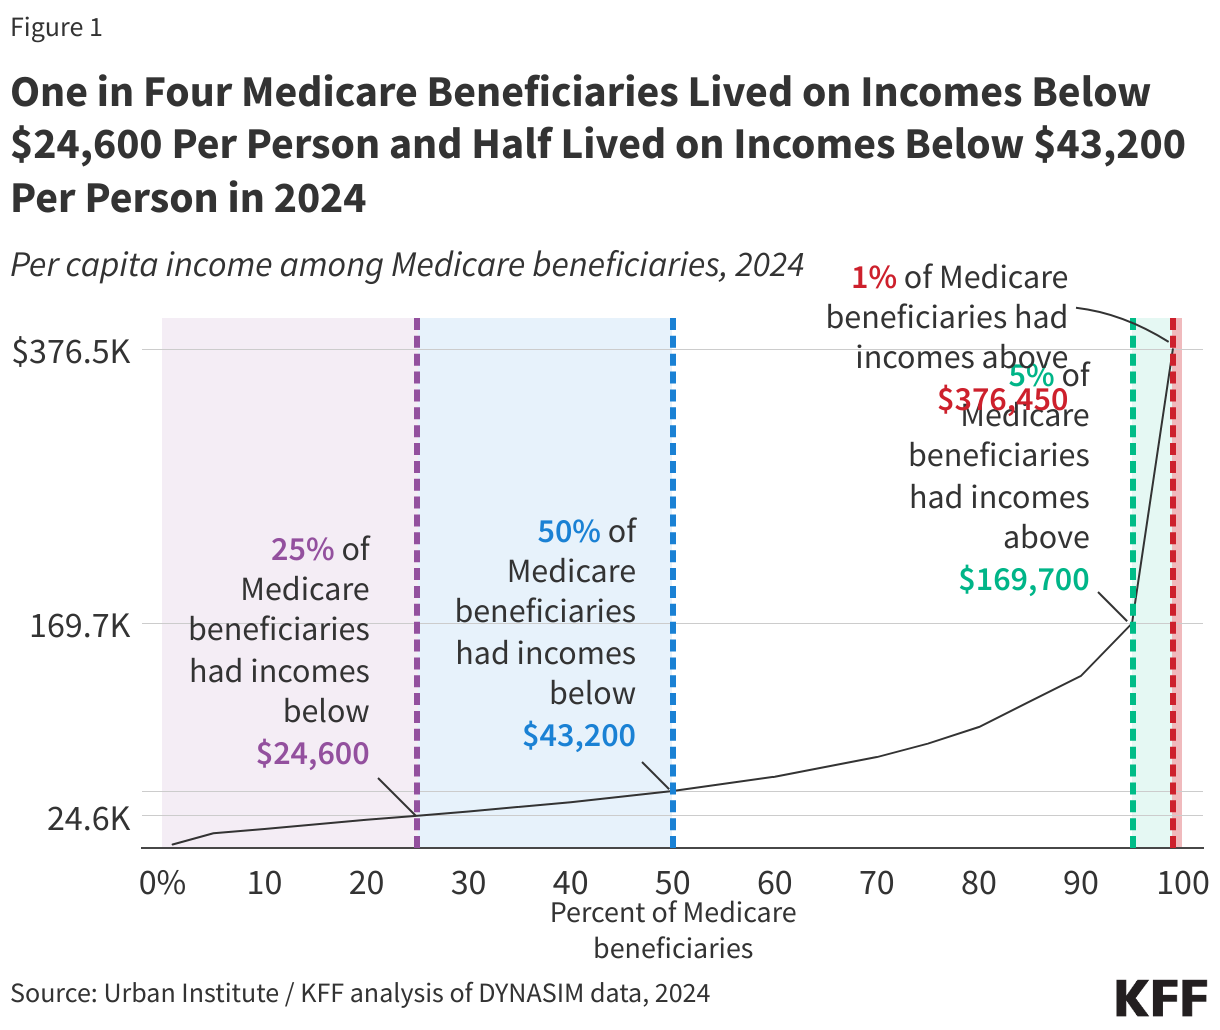
Per person estimates of income varied by age, race and ethnicity, and gender, though nearly all beneficiaries across groups had at least some per capita income in 2024, in large part due to Social Security (Figure 2, Appendix Table 1).
Age: Median per capita income was substantially lower among Medicare beneficiaries ages 85 and older ($37,000) than among those ages 65 to 74 ($47,300) or 75 to 84 ($45,650, Figure 2). This pattern reflects the lower likelihood of having income from earnings at older ages (for example, 49% of beneficiaries ages 65-74 and 20% of beneficiaries ages 75-84 had income from earnings in 2024, compared to just 1% of beneficiaries ages 85 and older). Medicare beneficiaries under age 65, who qualify for Medicare because of a long-term disability, had the lowest median per capita income of any age group (Figure 2). One in four beneficiaries under age 65 lived on incomes below $15,800 per person, which was just above the federal poverty threshold of $15,060 for a single person in 2024.
Race/Ethnicity: At the median and among those in the bottom 25% of the income distribution, per capita income was lower among Black and Hispanic beneficiaries than among White beneficiaries (Figure 2). One quarter of Black beneficiaries lived on incomes below $20,150 per person, and one quarter of Hispanic beneficiaries lived on incomes below $14,150 per person, compared to $27,550 per person among White beneficiaries, reflecting wider racial and ethnic disparities in job opportunities and earnings during their working years, lower access to pension and other retirement benefits, and fewer years of education. Older Black and Hispanic beneficiaries are also more likely than older White beneficiaries to report difficulties paying for health care expenses, given the larger share who live with lower incomes.
Gender: Per capita income was lower among women than men, both at the median ($42,350 vs. $44,150) and among beneficiaries in the bottom 25% of the income distribution ($23,900 vs. $25,500, Figure 2). On average, women have lower wages than men during their working years, even when working in similar roles, and often take on a larger share of unpaid family caregiving, resulting in lower lifetime earnings and lower Social Security benefits once they retire. These gender differences persisted across age groups among those age 65 or older (Appendix Table 2). For example, median income among women ages 85 and older was just $34,300 per person, compared to $40,750 per person among men of the same age.
Marital Status: Both at the median and among those in the bottom 25% of the income distribution, per capita income was higher among beneficiaries who were married, compared to those who were widowed, divorced or single. One quarter of married beneficiaries lived on incomes below $28,550 per person, compared to $25,250 among widowed beneficiaries, $22,150 among divorced beneficiaries, and $15,600 among single beneficiaries (Appendix Table 1). Spouses (or ex-spouses for marriages longer than ten years) can opt to receive half of their spouse’s Social Security benefit in lieu of the benefit based on their own earnings, which may offer greater flexibility to beneficiaries who are or have been married.
Education: Both at the median and among beneficiaries in the bottom 25% of the income distribution, per capita income rose with educational attainment. One quarter of beneficiaries with less than a high school education lived on incomes below $13,350 per person, compared to $41,250 among beneficiaries with a college degree (Appendix Table 1).
Savings among Medicare Beneficiaries
One in four Medicare beneficiaries (16.5 million) had savings below $18,950 per person in 2024, while half (32.9 million) had savings below $110,100 per person (Figure 3). One in ten (6.6 million) had no savings or were in debt. Among the wealthiest Medicare beneficiaries, the top five percent (3.3 million) had savings exceeding $1.7 million per person, including the top one percent (0.7 million) whose savings exceeded $4.3 million per person.
Per person estimates of savings, as well as the share of beneficiaries without savings or with debt, varied by age, race and ethnicity, and gender (Figure 4, Appendix Table 1).
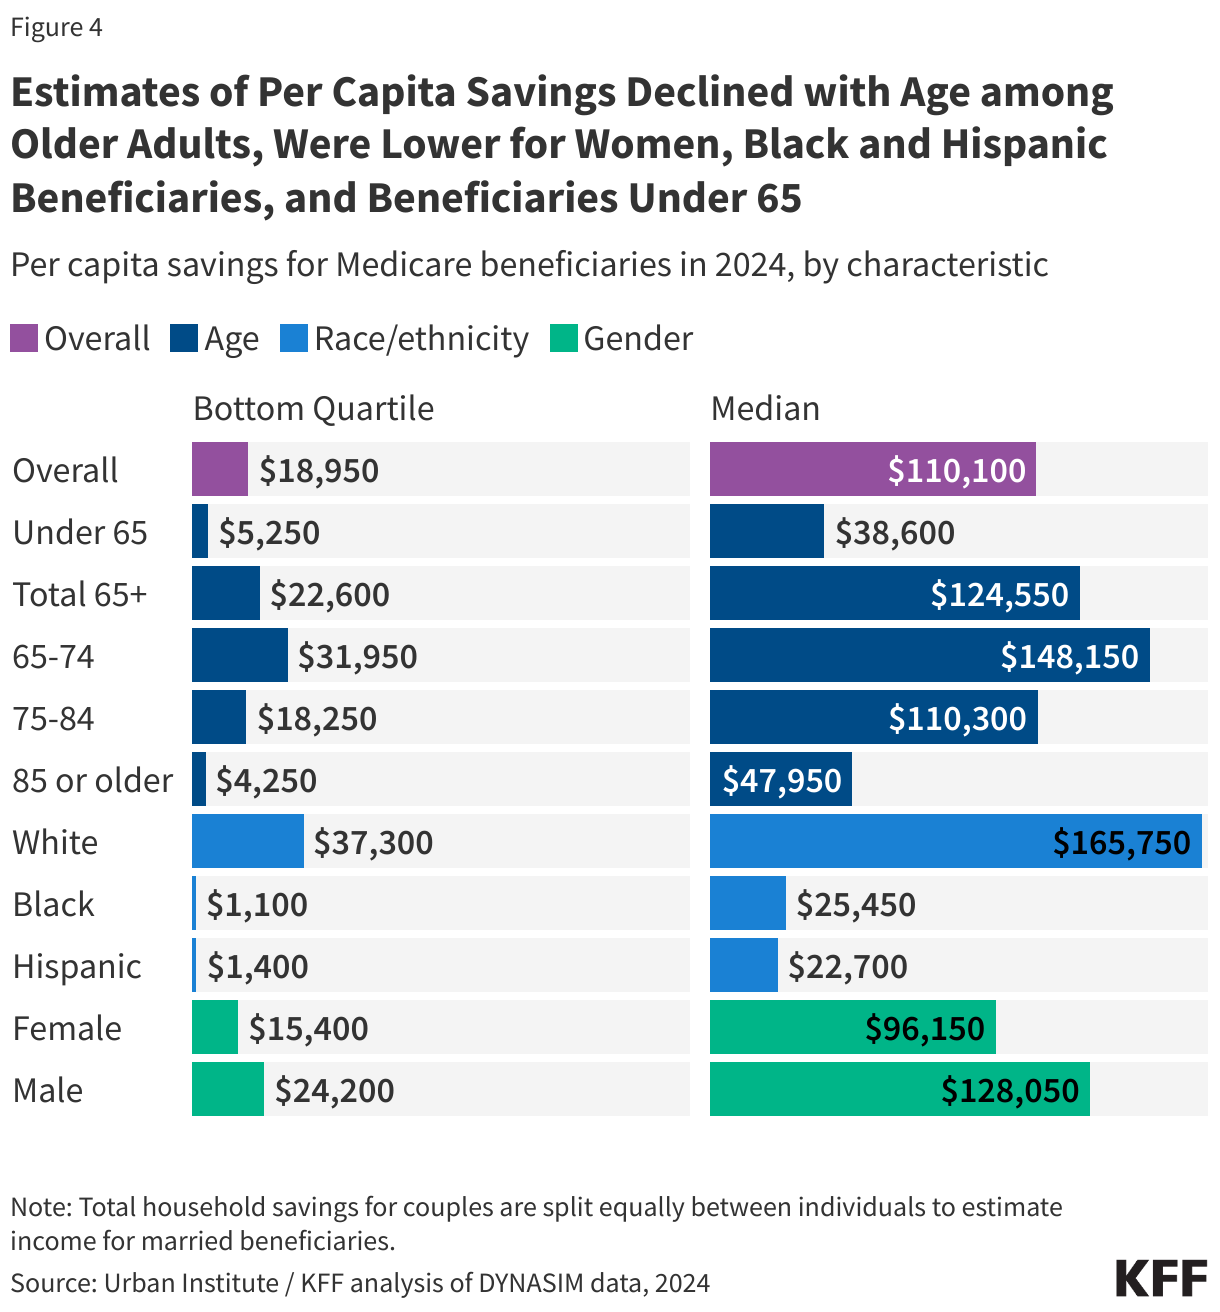
Age: Both at the median and among those in the bottom 25% of the savings distribution, per capita savings declined with age among Medicare beneficiaries ages 65 and older (Figure 4). One quarter of beneficiaries ages 85 and older had savings below $4,250 per person (vs. $31,950 among beneficiaries ages 65-74), and half had savings below $47,950 per person (vs. $148,150 among beneficiaries ages 65-74). By way of comparison, the median annual cost of care nationwide in 2023 was $116,800 for a private room in a nursing home, and $64,200 for an assisted living facility.
Among beneficiaries with disabilities under the age of 65, one quarter had savings below $5,250 per person (vs. $22,600 among seniors), and half had savings below $38,600 per person (vs. $124,550 among seniors, Figure 4). Roughly 15% of beneficiaries under age 65 (vs. 9% of seniors) had no savings or were in debt (Appendix Table 1). Relatively low income and savings may present a particular challenge to Medicare beneficiaries under age 65, who are over three times more likely than older beneficiaries to report a problem paying a medical bill in the past 12 months, and nearly twice as likely to report delaying or forgoing a health care service, such as doctor visits or prescription drugs, due to their cost.
Race/Ethnicity: Median per capita savings were higher among White beneficiaries than among Black and Hispanic beneficiaries. Likewise, among beneficiaries in the bottom 25% of the savings distribution, per capita savings among White beneficiaries ($37,300) were more than 30 times higher than among Black beneficiaries ($1,100) and more than 25 times higher than among Hispanic beneficiaries ($1,400, Figure 4). More than one in five Black and Hispanic beneficiaries (20% and 19%, respectively) had no savings or were in debt, compared to just 6% of White beneficiaries (Appendix Table 1). Racial and ethnic disparities in per capita savings are generally larger than disparities in income, and persist even among beneficiaries with similar levels of education, suggesting wider inequities in financial security and intergenerational wealth.
Gender: Per capita savings were lower among women than men, both at the median ($96,150 vs. $128,050) and among beneficiaries in the bottom 25% of the savings distribution ($15,400 vs. $24,200), and a larger share of women than men had no savings or were in debt (11% vs. 8%, Appendix Table 1). Average life expectancy at age 65 is somewhat higher for women than men, and those with less wealth accumulation may be at greater risk of running out of retirement savings as they age. As with income, gender differences in savings persisted across age groups among those 65 and older (Appendix Table 2).
Marital Status: Married beneficiaries had median per capita savings ($173,500) that were more than twice as high as among beneficiaries who were widowed ($82,300) or divorced ($71,700) and nearly six times higher than among beneficiaries who were single ($29,250, Appendix Table 1). A similar pattern was true among beneficiaries in the bottom 25% of the savings distribution. Likewise, a smaller share of married beneficiaries (5%) had no savings or were in debt, compared to beneficiaries who were widowed (11%), divorced (14%), or single (21%).
Education: Beneficiaries with a college degree had median per capita savings ($332,200) that were more than five times higher than beneficiaries with only a high school degree ($65,150) and more than 30 times higher than beneficiaries with less than a high school education ($10,650, Appendix Table 1). A similar pattern was true among beneficiaries in the bottom 25% of the savings distribution. Just 4% of beneficiaries with a college degree had no savings or were in debt, compared to 11% of beneficiaries with only a high school degree and 25% of beneficiaries with less than a high school education.
Home Equity among Medicare Beneficiaries
Half of all Medicare beneficiaries (32.9 million people) had less than $128,200 per person in home equity in 2024, while more than one quarter (26% or 17.1 million) had no home equity at all. At the higher end of the distribution, the top five percent of Medicare beneficiaries (3.3 million people) had more than $886,800 per person in home equity, including the top one percent (0.7 million) who had more than $1.5 million per person (Figure 5).
Per person estimates of home equity, as well as rates of homeownership, varied by age, race and ethnicity, and gender (Figure 6, Appendix Table 1).
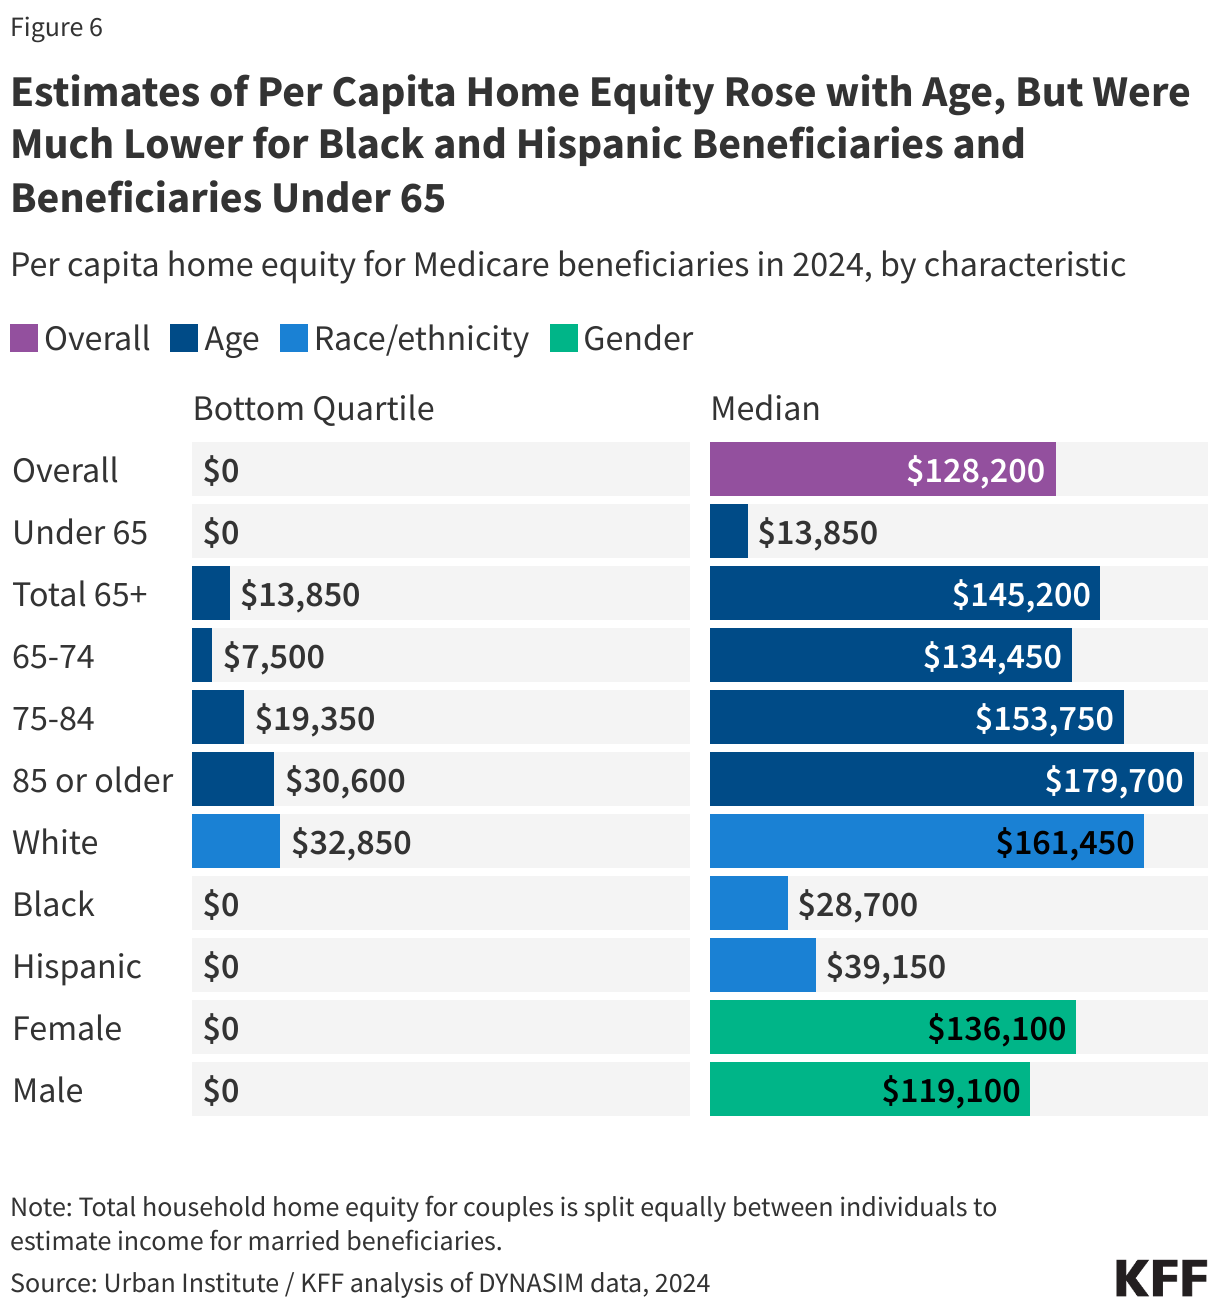
Age: Median per capita home equity rose with age, from $134,450 among those ages 65-74 to $179,700 among those ages 85 and older, likely reflecting the larger share of homeowners who had reduced or paid off mortgage debt in older age groups. Unlike other financial assets, which may decrease as seniors leave the workforce and spend their accumulated savings, homes typically store and accumulate equity over time. Median per capita home equity was lowest among beneficiaries under the age of 65 ($13,850 vs. $145,200 among seniors), and one in two (48%) had no home equity at all (vs. 23% of seniors) (Figure 6).
Race/Ethnicity: As with income and savings, median per capita home equity was higher among White beneficiaries ($161,450) than among Black ($28,700) or Hispanic ($39,150) beneficiaries (Figure 6). This was due in part to differences in rates of homeownership, with close to half of Black (44%) and Hispanic (42%) Medicare beneficiaries having no home equity at all, compared to one in five (20%) White beneficiaries.
Gender: Median per capita home equity was somewhat higher among women than men ($136,100 vs. $119,100, Figure 6). While rates of homeownership were comparable (75% vs. 73%), differences in life expectancy mean that a larger share of women survive to older ages, allowing more time to accumulate home equity and, in the case of widowed beneficiaries, to own the full share of their homes.
Marital Status: The majority of married and widowed beneficiaries were homeowners, with median per capita home equity of $151,500 and $221,350, respectively. Just 13% of married beneficiaries and 20% of widowed beneficiaries had no home equity at all. By contrast, many divorced beneficiaries and most single beneficiaries were not homeowners. Median per capita home equity among divorced beneficiaries was $54,600 (41% were not homeowners). Single beneficiaries had the lowest rates of homeownership – 64% had no home equity – with median per capita home equity of $0 (Appendix Table 1).
Education: As with income and savings, homeownership and median per capita home equity both rose with educational attainment. Among beneficiaries with a college degree, median per capita home equity was $236,950, while 16% had no home equity. Among beneficiaries with less than a high school education, median per capita home equity was more than 25 times lower ($8,650) and nearly half (48%) were not homeowners (Appendix Table 1).
Alex Cottrill, Juliette Cubanski, and Tricia Neuman are with KFF. Karen Smith is with the Urban Institute.