


Medicaid, as the primary program providing comprehensive coverage of health care and long-term services and supports to about 80 million low-income people in the United States, accounts for one-fifth of all personal health care spending in the United States and a large share of state budgets. During its 60 years since enactment, Medicaid’s share of health insurance coverage and health care spending have incrementally increased; the program has evolved over time through a series of legislative and judicial actions, within the context of broader changes in the health care landscape. Now, landmark changes to Medicaid coverage and enrollment policies are set to roll out over the next several years.
According to the Congressional Budget Office (CBO), the recently enacted reconciliation package is estimated to reduce federal Medicaid spending by $911 billion over 10 years (after accounting for interactions that produce overlapping reductions across different provisions of the law), and to increase the number of uninsured people by 10 million in 2034. The most recent projections for national health spending do not account for the changes in the law; but changes in the law are expected to have big implications for Medicaid coverage and spending that could reverse longstanding incremental trends. Policy changes in the reconciliation package that lead to more uninsured people are likely to increase out-of-pocket spending as a share of national health care spending. Shifts in spending patterns are likely to be more profound over time and beyond the ten year projection period if there are no other changes in federal laws that affect health spending.
To provide historical context for how changes to Medicaid spending may impact national health spending trends, this brief explores how Medicaid spending contributes to national health spending and how different service areas contribute to Medicaid costs. This brief uses National Health Expenditures (NHE) historic data, published annually by the Centers for Medicare & Medicaid Services, which provide estimates of national spending on health care, by payer and by type of service. The analyses in this brief focus on spending for personal health care, which excludes the costs of public health programs and payers’ administrative spending (see Methods).
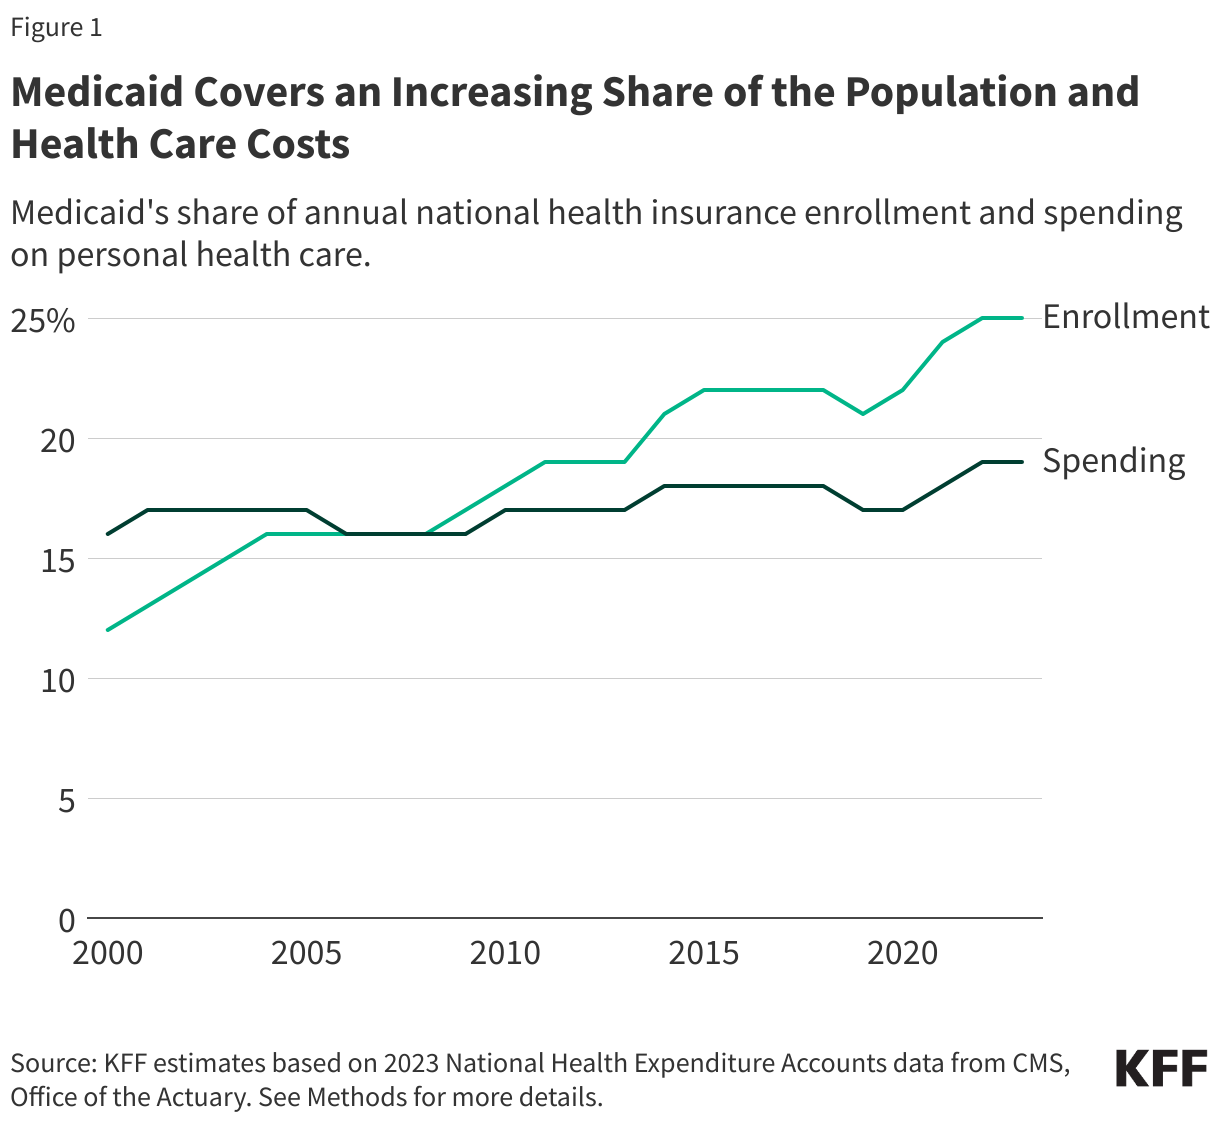
1. Over time, Medicaid has covered an increasing share of the population and health care costs.
Over the past two decades, the percent of the population enrolled in Medicaid increased by more than 10 percentage points (from 12% in 2000 to 25% in 2023 by NHE enrollment estimates). During the same time, Medicaid’s share of national health spending increased by only 3 percentage points, from 16% to 19%. Medicaid spending is driven by multiple factors, including the number and mix of enrollees, their use of health care and long-term services and supports, the prices of Medicaid services, and state policy choices about benefits, provider payment rates, and other program factors. Some of the faster growth in Medicaid enrollment relative to spending is that enrollment growth over the past two decades was driven by increased enrollment stemming from the Great Recession, implementation of the Affordable Care Act (ACA) Medicaid expansion, and the COVID-19 pandemic. Each of those events spurred increased enrollment of working-age adults and their families, groups that tend to have lower per-enrollee Medicaid costs than older adults and people who come into Medicaid because they need long-term care. CBO estimates predict that changes to Medicaid enacted in the reconciliation package will result in a downward shift in future Medicaid spending and in enrollment. KFF analyses show how these recent changes to Medicaid policy are likely to reduce federal Medicaid spending and impact enrollment, with varying impacts to different states or areas.
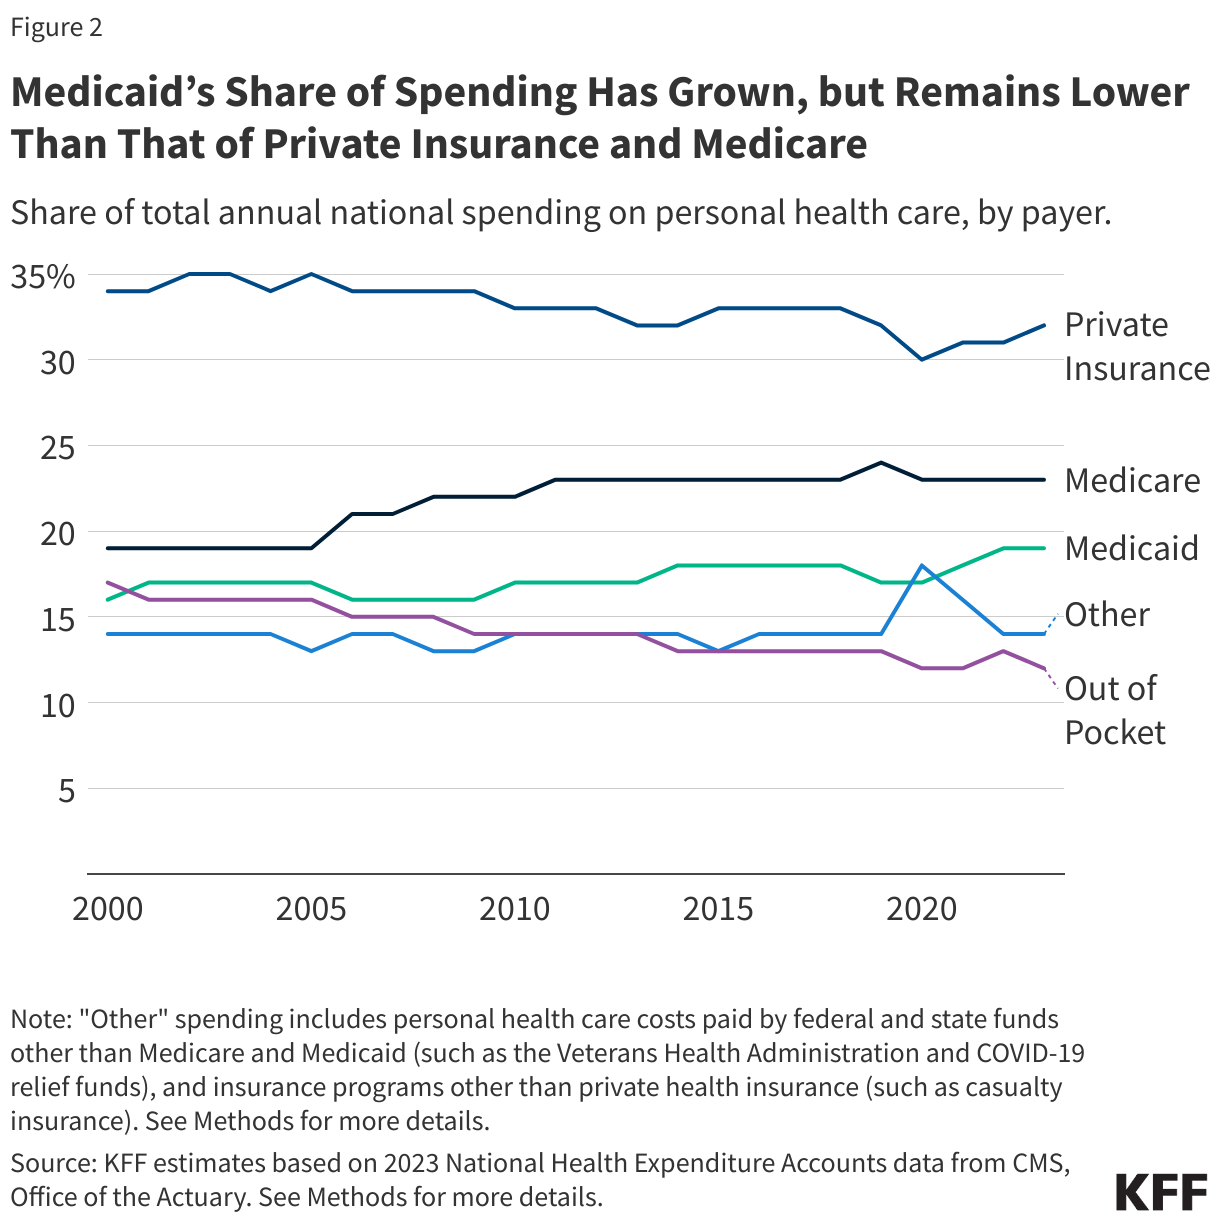
2. Medicaid’s share of spending has grown, but remains lower than that of private insurance and Medicare.
Prior KFF analysis has shown that generally, third party payers cover a greater share of total health spending than in previous decades because more people have gained coverage, especially public coverage, and payers’ spending per enrollee has grown. The total share of national health care spending for each type of coverage reflects the number and mix of enrollees and the amount spent to cover each enrollee. The share of health care spending paid by people out-of-pocket decreased as more spending was paid by Medicare and private insurance. Out-of-pocket spending includes payments for care from people who are not insured, and payments for care from people with health coverage when coverage requires enrollees to pay some of the costs. Common types of out-of-pocket spending among people with coverage include copayments (a flat fee per service), coinsurance (a percentage of the total costs), and deductibles (an amount enrollees pay before coverage kicks in). Historically, one difference between Medicaid and other forms of health coverage was the low out-of-pocket spending. Estimated increases in the uninsured following implementation of the reconciliation package could reverse incremental declines in out-of-pocket costs.
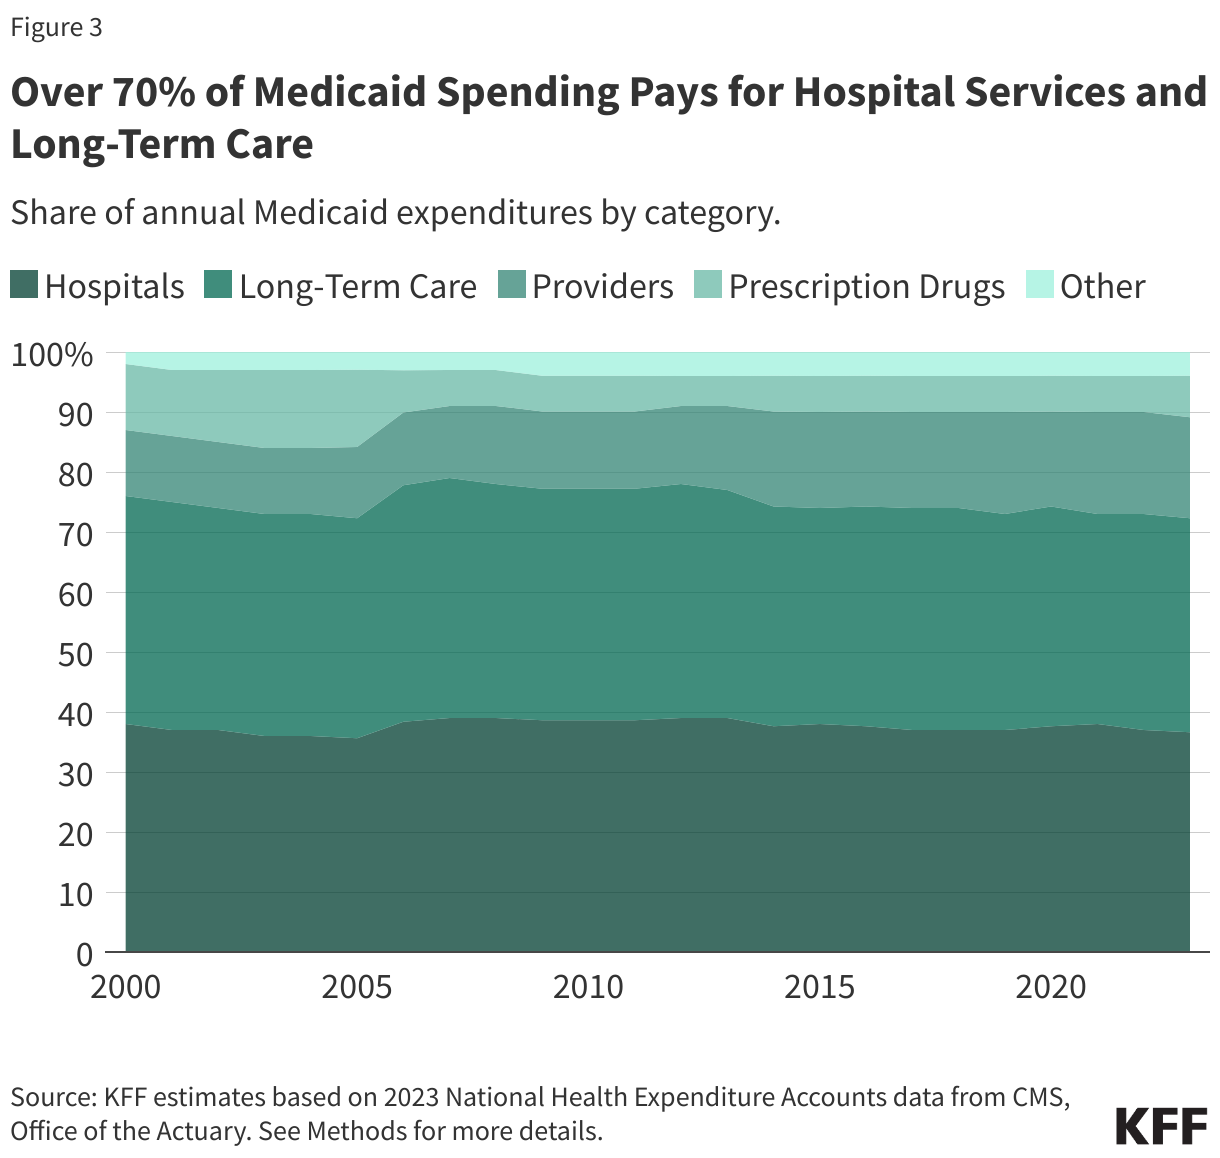
3. Over 70% of Medicaid spending pays for hospital services and long-term care.
Over the last 23 years, the largest share of Medicaid spending paid for hospital services, which accounted for 38% of Medicaid spending on average and varied between 37% and 39% during the 2000-2023 period. Medicaid mirrors broader hospital spending trends; spending on hospitals makes up the largest share of all health care spending, a trend projected to continue. During the same period, long-term care accounted for an average of 37% of Medicaid spending, although it declined somewhat from a high of 40% in 2007 to 36% in 2023. The category with the greatest relative growth was payments to providers such as physicians which increased from 11% in 2000 to 17% in 2023. The percent of spending that paid for prescription drugs decreased from 11% in 2000 to 7% in 2023, which is likely attributable to the enactment of the Medicare prescription drug benefit which took effect in 2006. Prior to that point, Medicaid paid for prescription drugs for low-income Medicare beneficiaries who were also enrolled in Medicaid (e.g., dual-eligible individuals).
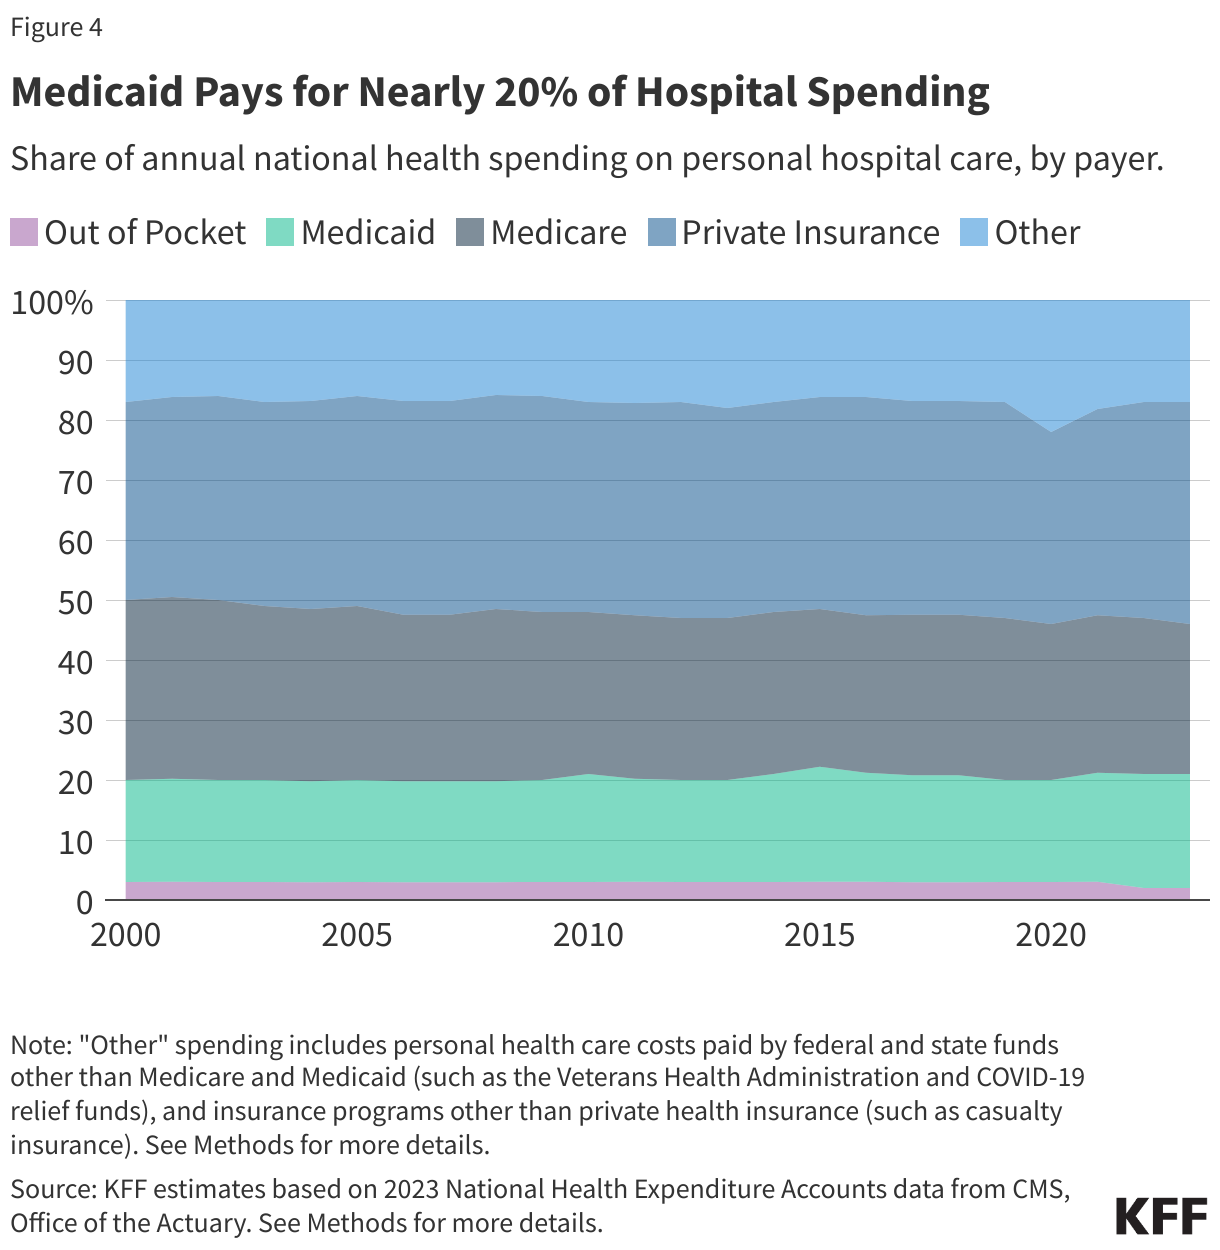
4. Medicaid pays for nearly 20% of hospital spending.
Medicaid pays for nearly 20% of hospital spending, a share that has changed little since 2000. During that time, Medicare’s share of national spending on hospital care decreased from 30% in 2000 to 25% in 2023, while the share paid by private health insurance rose from 33% to 37%. People pay a much smaller percentage of hospital spending out-of-pocket compared with other types of health care. Medicaid covered 41% of all U.S. births in 2023; births are the most common reason for a hospital inpatient stay. Medicaid financing for hospitals is complex, but Medicaid studies have shown that Affordable Care Act (ACA) Medicaid expansion is associated with improved hospital financial performance and lower likelihood of hospital closure, particularly in rural areas.
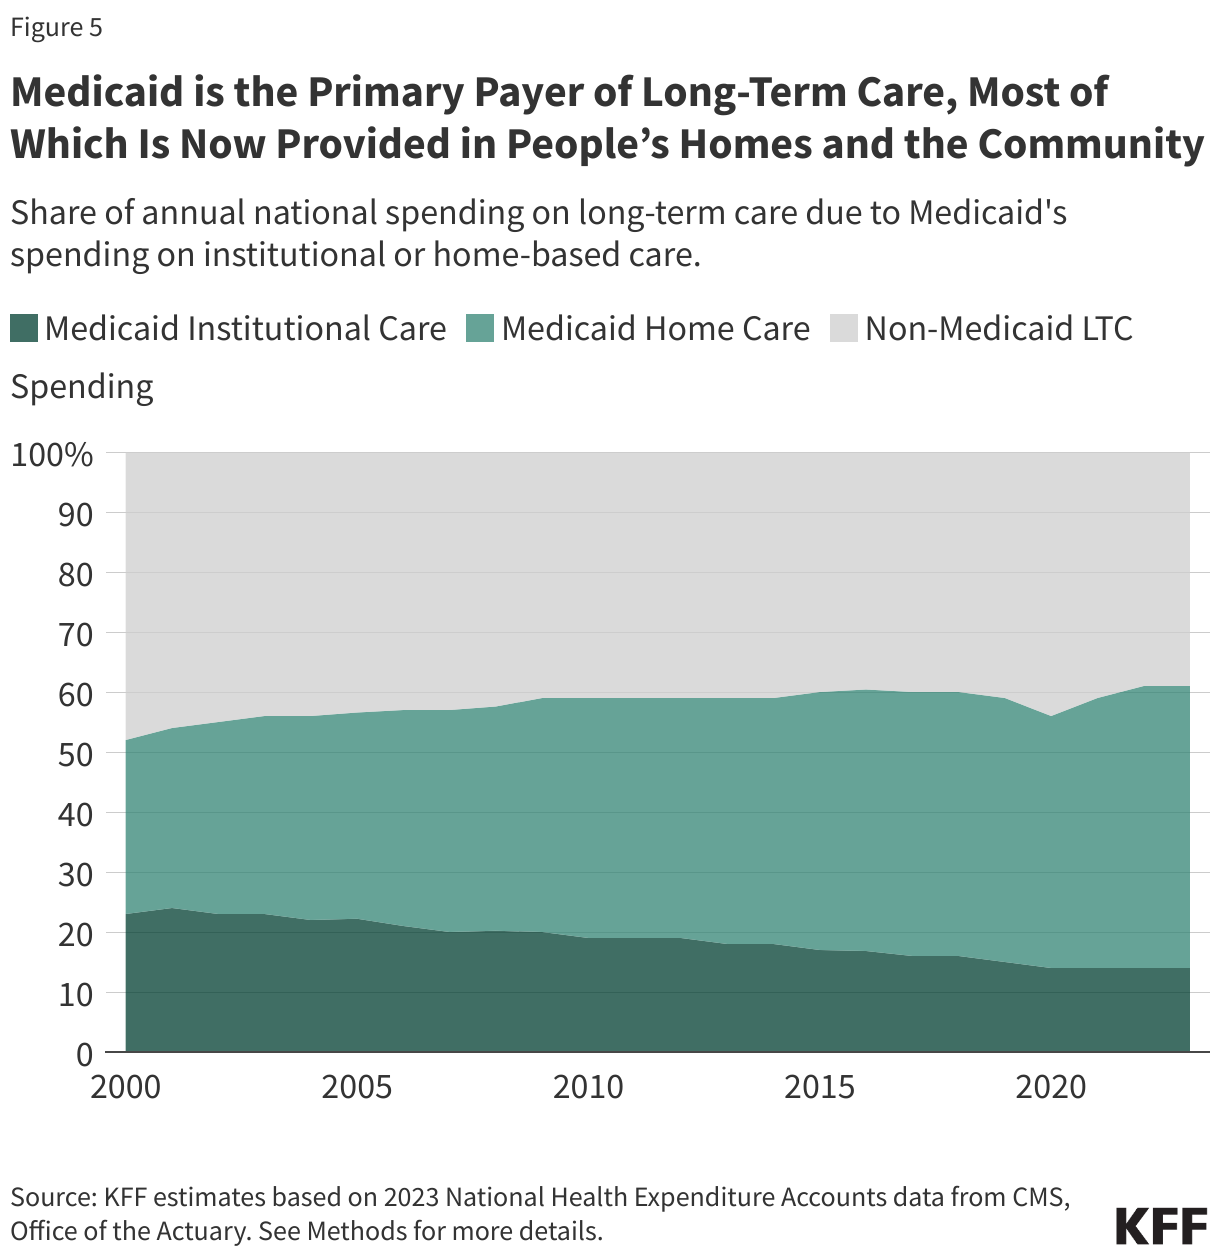
5. Medicaid is the primary payer of long-term care, most of which is now provided in people’s homes and the community.
Medicaid continues to be the primary payer of long-term care, comprising an increasing share of all spending on long-term care. Medicaid’s share of spending on long-term care rose nine percentage points, growing from 52% in 2000 to 61% in 2023. Since 2000, Medicaid’s spending on care delivered in people’s homes and communities (e.g., home care) increased faster than spending on institutional care such as nursing facilities. In 2000, the 52% of long-care spending that was paid by Medicaid included 29% on home care and 23% on institutional care. In 2023, the 61% that was paid by Medicaid included 47% on home care and only 14% on institutional care. Prior KFF analysis has shown that in 2021, three-quarters of the 5.7 million people who used Medicaid long-term care were receiving home care, although that percentage varies across the states widely. The larger share of people receiving care in the community as opposed to in an institution reflects initiatives to make home care more widely available in recent years and to remove what has been referred to as the “institutional bias” in Medicaid.
Methods
This analysis uses National Health Expenditures (NHE) historic data. Unlike other sources of information on health care spending, the NHE data use an accounting structure that captures all expenditures of health care goods and services and investment in the health care sector. Expenditures are classified into high-level service categories and by source of payment. Data sources include federal administrative data, household and individual surveys, surveys of businesses, and economic data from the Bureau of Labor Statistics and the Bureau of Economic Analysis. Medicaid spending estimates are derived from financial reporting through Form CMS-64, except for durable medical equipment estimates which are developed from person-level payment data.
See the NHE Accounts Methodology documentation for additional information including definitions, sources, and methods; CMS publishes both complete documentation and short definitions.
Enrollment: This KFF analysis uses NHE Accounts enrollment data to estimate Medicaid’s share of total health insurance enrollment (Figure 1). NHE Accounts data estimates Medicaid enrollment using the Medicaid Statistical Information System (MSIS) for years 2000-2013, and enrollment projections reported on form CMS-64 for years 2014-2023. The NHE Accounts data estimates for total health insurance enrollment include private health insurance, Medicare, Medicaid, CHIP, and the Departments of Defense and of Veterans Affairs.
Personal Health Care Services: Personal health care services in the NHE Accounts data represent aggregate revenue received by health care providers and retail providers of medical goods and services. Cost estimates for personal health care services expenditures exclude administrative costs, government public health activities, or investments in structures or equipment. KFF analyzes NHE personal health care data using service categories (i.e. “hospitals,” “providers,” or “prescription drugs,”) that align with the classification system used within the NHEA, except for Long-Term Care.
Spending by Payer: NHE Accounts data estimate spending attributable to certain payer categories. KFF uses the payer categories defined by the NHE Accounts data and defines “Other” spending (Figures 2 and 4) below. For personal health care services:
- Medicaid spending estimates include both state and federal spending on both fee-for-service and managed care enrollees but exclude Children’s Health Insurance Programs (CHIP) spending.
- Medicare spending estimates include Medicare Parts A, B, and C (Medicare Advantage). Medicare spending estimates also include Medicare Part D and Medicare Advantage Part D. Private supplemental Medicare insurance, i.e. Medigap and employer-sponsored Medicare Part D, is excluded from Medicare spending and included in private insurance spending.
- Private Insurance spending estimates include premiums and benefits from traditional fully-insured health coverage whether purchased individually or through an employer, self-insured employer health benefit plans, plans purchased through the Affordable Care Act marketplaces, and indemnity plans such as those covering hospital care or long-term care. Private insurance spending estimates also include supplemental Medicare plans (e.g., Medigap).
- Out-of-Pocket spending estimates include direct consumer spending including coinsurance, deductibles, and any other amounts not covered by insurance. Premiums are included in private insurance spending and excluded from out-of-pocket spending.
- Other: KFF defines “Other” spendingas personal health care expenditures by the Children’s Health Insurance Program, the Indian Health Services, the Substance Abuse and Mental Health Services Administration, the Veterans Health Administration, federal spending through the Pre-Existing Conditions Insurance Plans (PCIP) or COVID-19 relief funds (e.g. the Provider Relief Fund), direct payments to the needy through general assistance programs (e.g. the State Pharmaceutical Assistance Program), certain state and local programs (e.g. temporary disability insurance or provider subsidies), and property or casualty insurance.
Spending by Service Category: KFF uses the NHE Accounts definitions for hospital care, provider care, and prescription drugs. KFF definitions for “Other” services (Figure 3) and “Long-Term Care (Figures 3 and 5) are included below.
- Hospital Care includes all services provided by hospitals to patients. These expenditures include the services of resident physicians, inpatient pharmacy, room and board and ancillary costs, hospital-based home health care, and other services billed by hospitals. Services rendered in a hospital by a physician who bills independently are considered Provider Care.
- Provider Care includes services provided in non-hospital clinics and practices. These include physician-operated practices, outpatient care centers, and certain federally operated clinics and clinics operated by non-physician clinicians (such as private-duty nurses, podiatrists, optometrists, chiropractors, or occupational therapists). Provider care also includes certain medical laboratory services.
- Prescription Drugs covers “retail” sales of products available only by a prescription, such as drugs, biologics, and diagnostic products.
- Other: KFF defines Medicaid spending on “Other” services to include personal health care expenditures not attributable to hospitals, providers, prescription drugs, nor long-term care. This includes dental care, durable medical equipment, non-durable medical equipment (e.g. diagnostic tools or wound dressings and other medical supplies), and non-prescription drugs.
- Long-Term Care: KFF defines long-term care to include spending for nursing care and continuing care retirement communities; home health; and other health, residential, and personal care if it is paid for by Medicaid, individuals who are paying out-of-pocket, the Children’s Health Insurance Program, the Indian Health Services, the Substance Abuse and Mental Health Services Administration, the Veterans Health Administration, general assistance, other federal programs, other state and local programs, school health. See 10 Things about LTSS for more information.