

Over half of all U.S. immigrants are naturalized citizens who are eligible to vote, representing nearly 24 million Americans and one in ten eligible U.S. voters overall. While many polls look at how U.S. voters overall view issues of immigration policy and enforcement, few look at the views of foreign-born voters themselves. Drawing on the KFF/New York Times 2025 Survey of Immigrants, this report examines how immigrant voters view President Trump and his immigration policies, including how those views are affected by – and have affected – their partisan alignment. Separate reports examine immigrants’ worries and experiences amid increased immigration enforcement and their health and health care experiences during the second Trump administration.
Key Takeaways
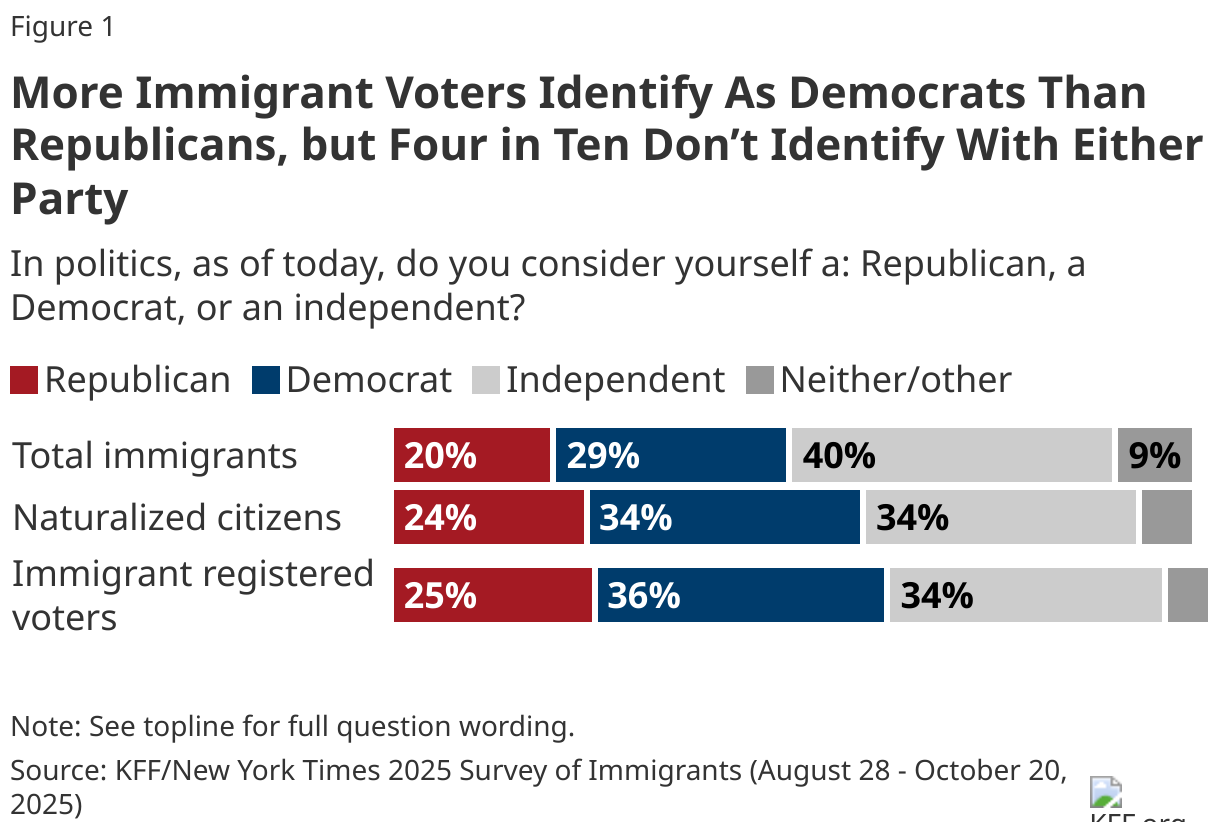
- The partisan identity of immigrant voters is mixed, with one quarter (25%) identifying as Republicans, just over a third (36%) identifying as Democrats, and four in ten saying they are either independent (34%) or don’t identify with either major U.S. political party (5%).
- Like the broader public, most immigrant voters disapprove of President Trump’s job performance, particularly when it comes to economic issues. While a majority of immigrant voters approve of the president’s efforts to secure the southern border, most disapprove of his handling of immigration policy more broadly. In fact, large majorities disapprove of specific policies such as “third country” deportations (80%), efforts to end birthright citizenship (69%), and the use of masked and plainclothes agents in immigration enforcement activities (67%). These views reflect immigrant voters’ own partisan alignment, but even large shares of Republican immigrant voters disapprove of deporting immigrants to countries they are not from (52%) and ending birthright citizenship (44%). While views of Trump’s immigration policies are not vastly different between immigrant voters and the broader public, immigrant voters are somewhat more likely to disapprove of efforts to end birthright citizenship.
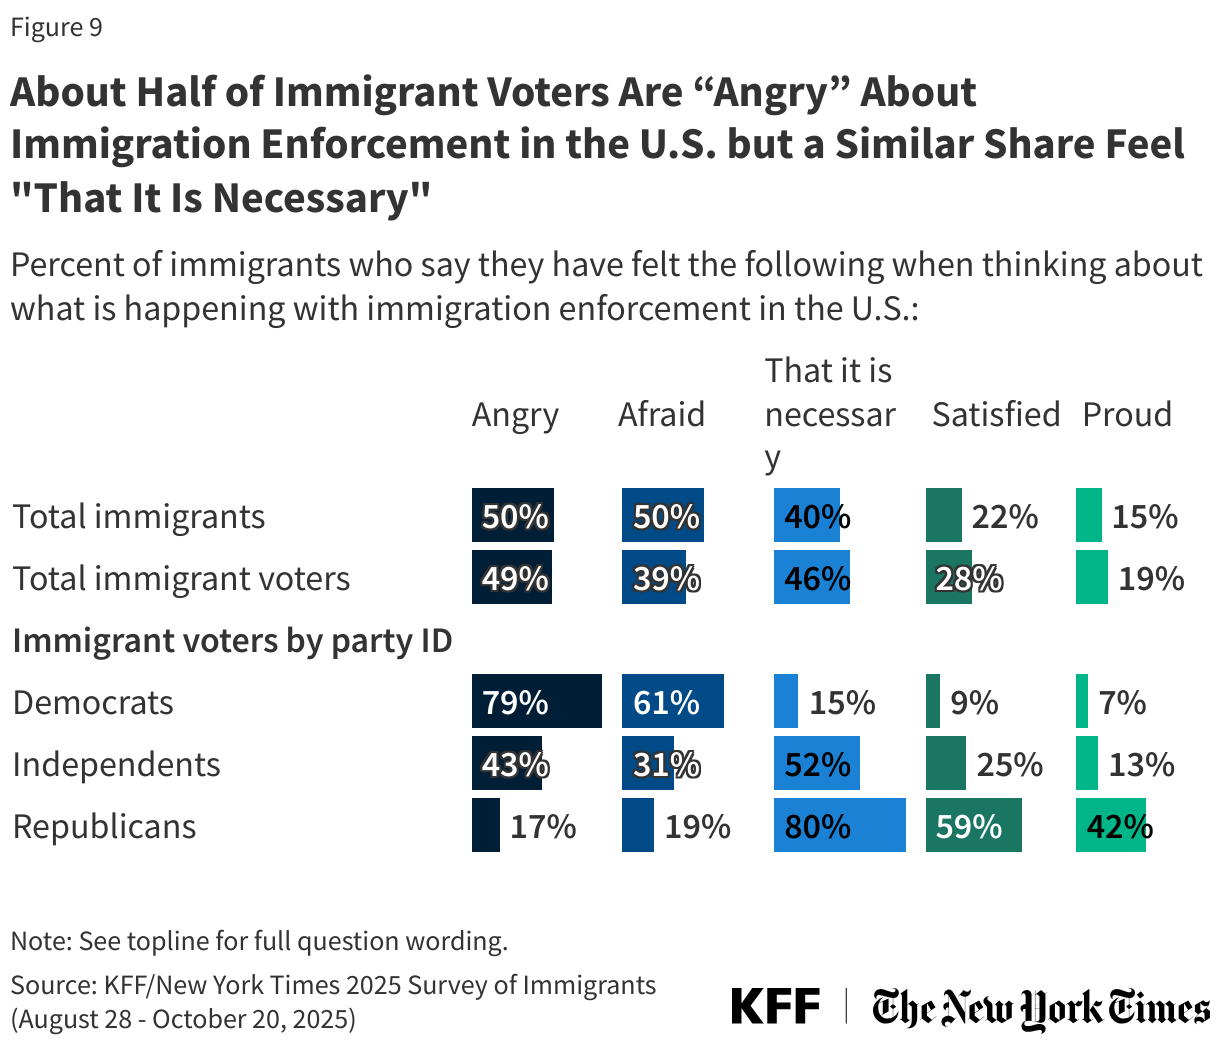
- Four in ten immigrant voters say the U.S. is too tough in enforcing immigration laws, and most disapprove of how Immigration and Customs Enforcement (ICE) is handling its job. While close to half (46%) feel that current immigration enforcement “is necessary,” large shares also say they feel “angry” (49%) and “afraid” (39%) about what is happening, while fewer feel “satisfied” (28%) or “proud” (19%).
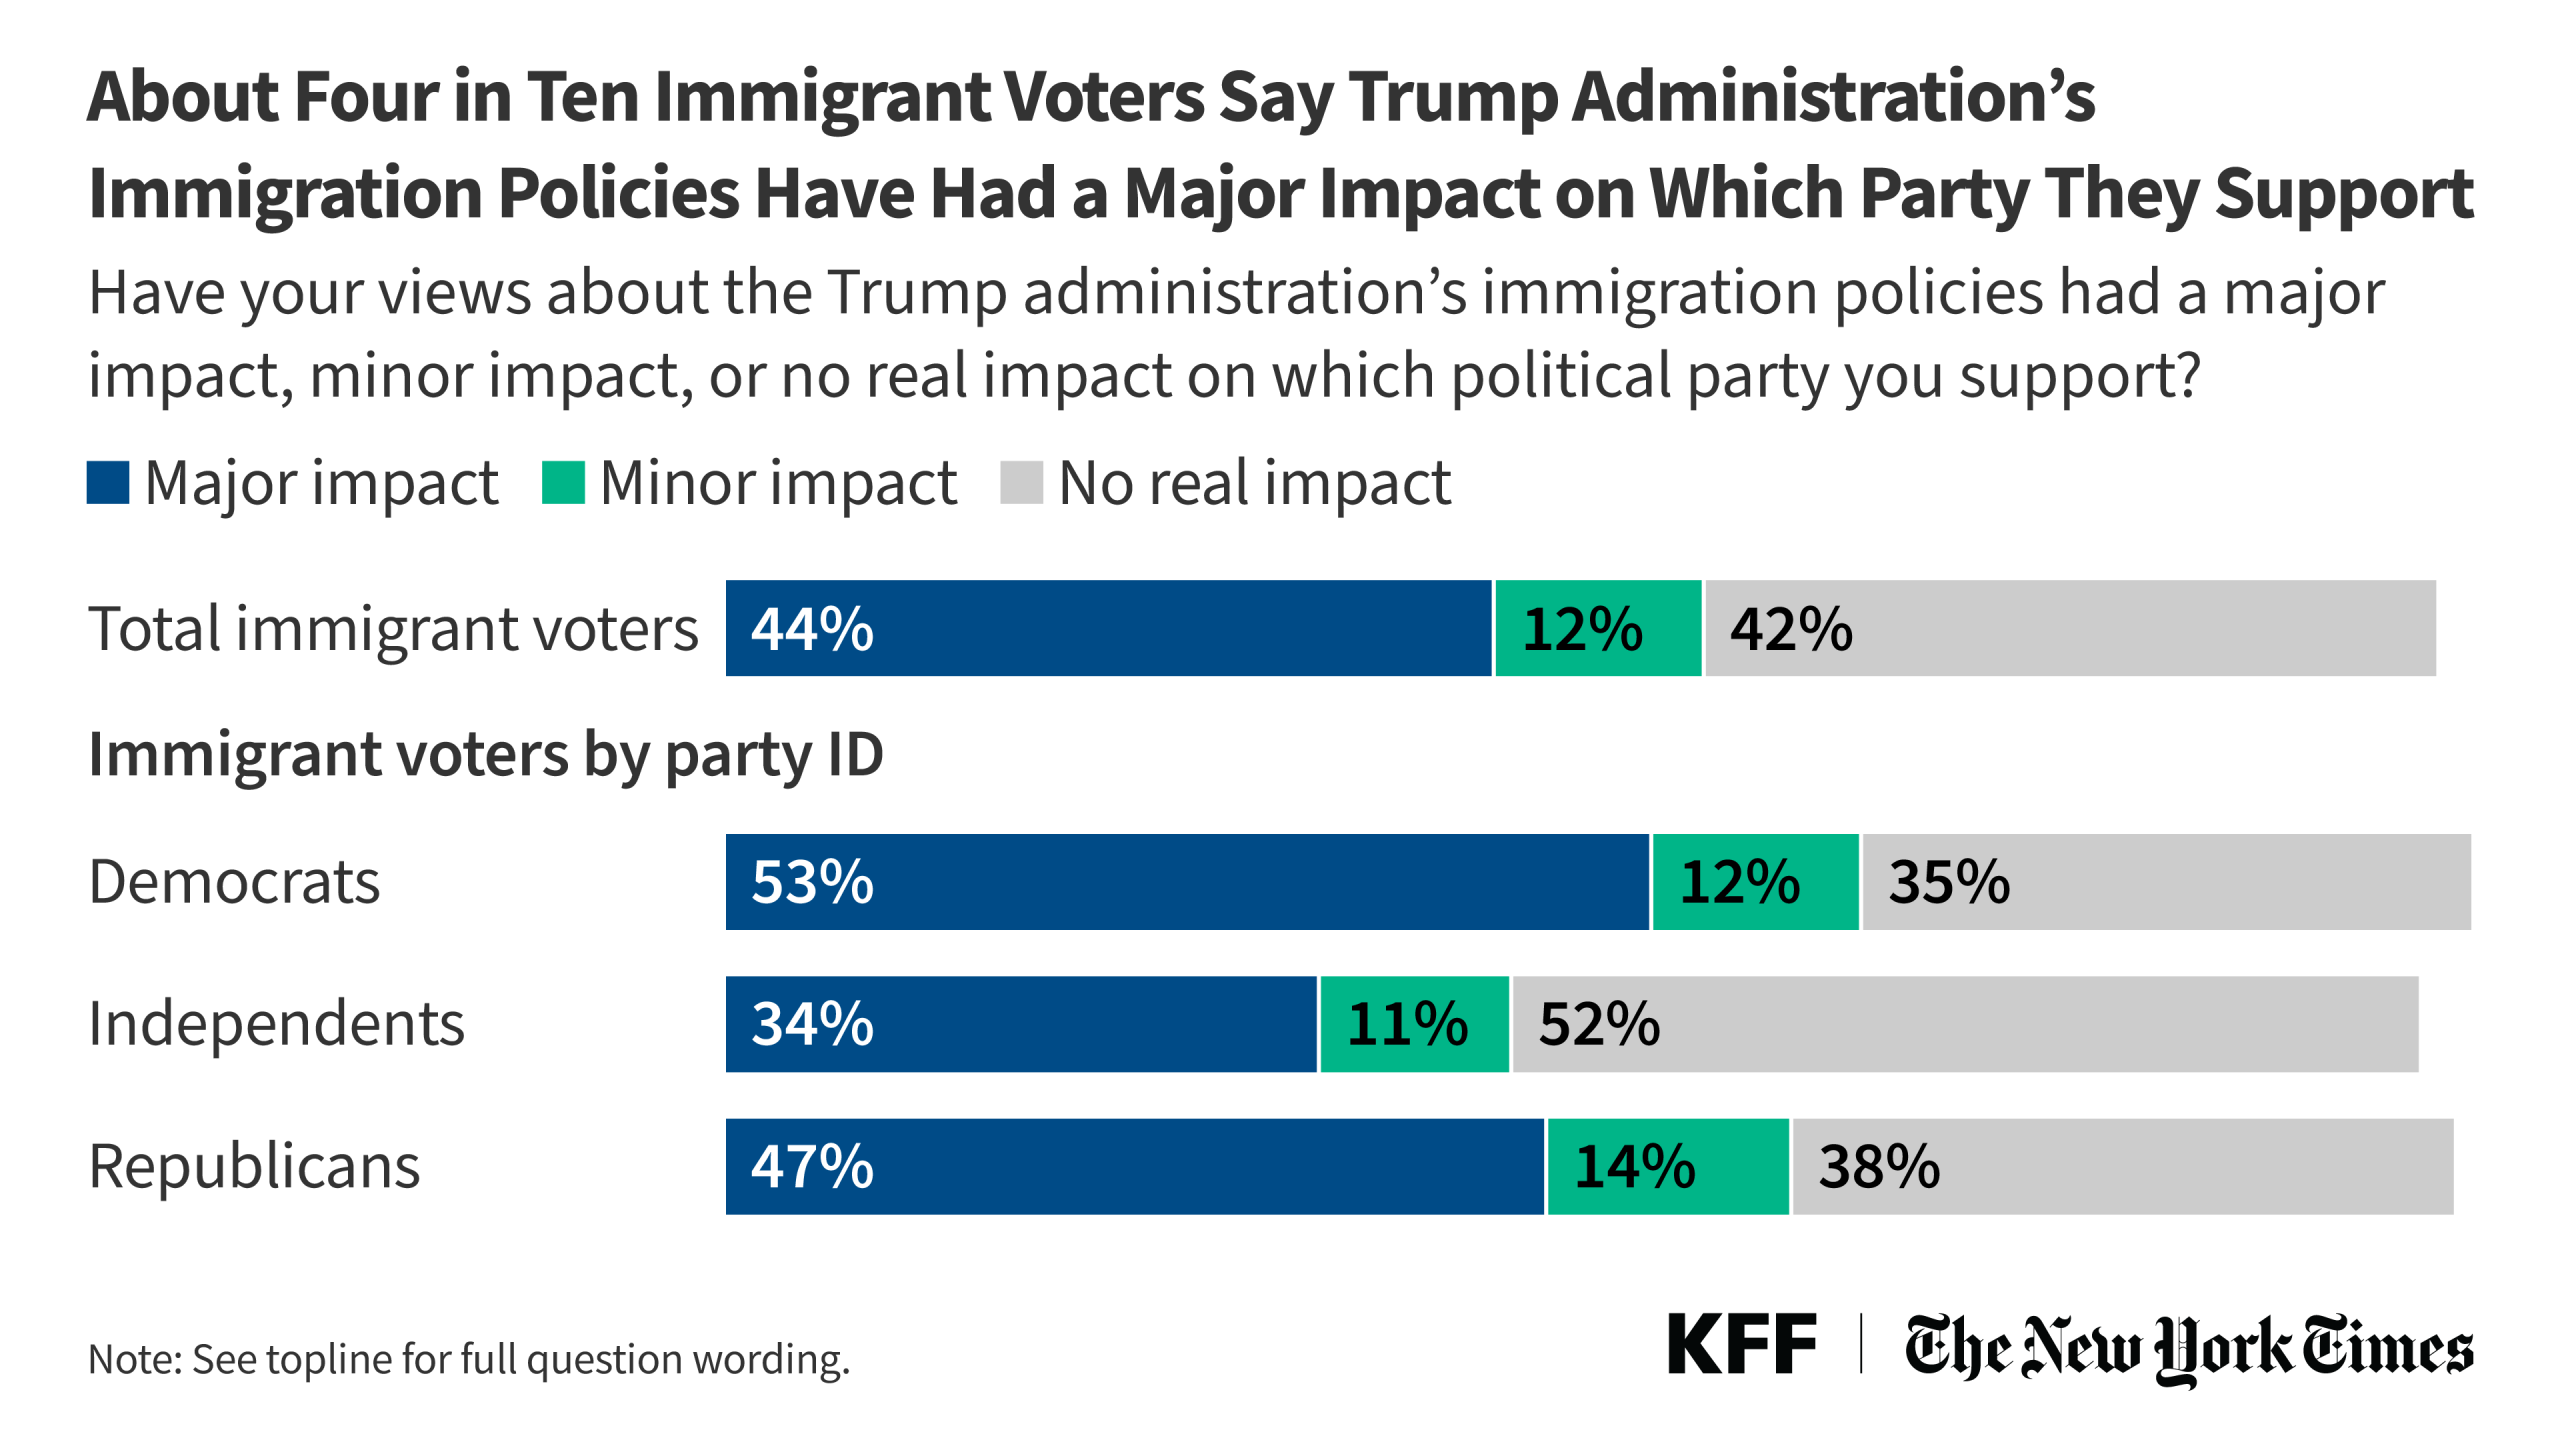
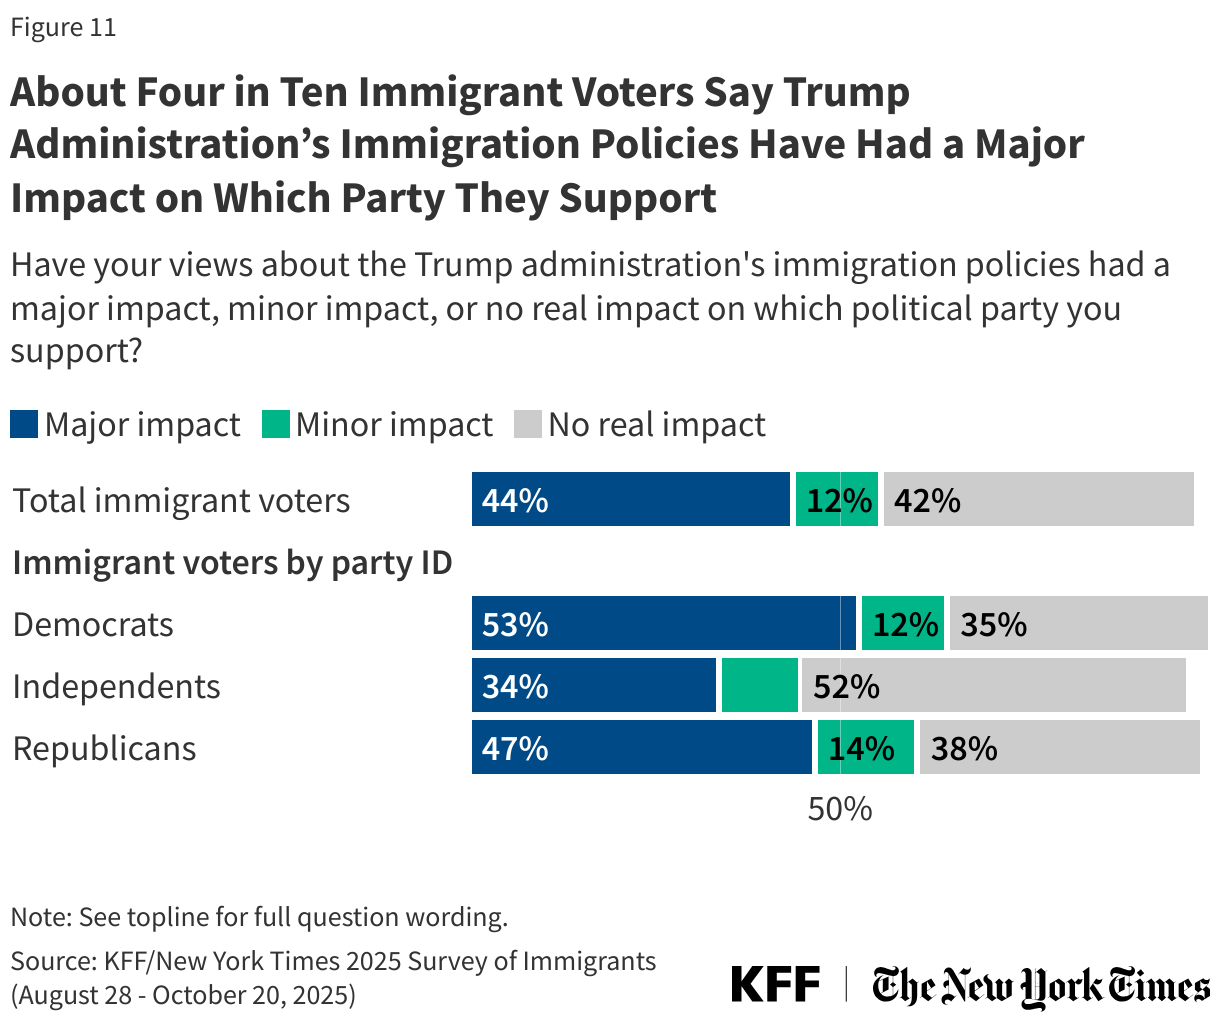
- These views may have implications for future elections, as nearly six in ten immigrant voters say the Trump administration’s immigration enforcement actions have had an impact on which political party they support, including over four in ten who say they’ve had a “major” impact. A larger share of this group says these policies have made them feel less supportive rather than more supportive of the Republican Party, though many express generally negative sentiments or frustration with both parties.
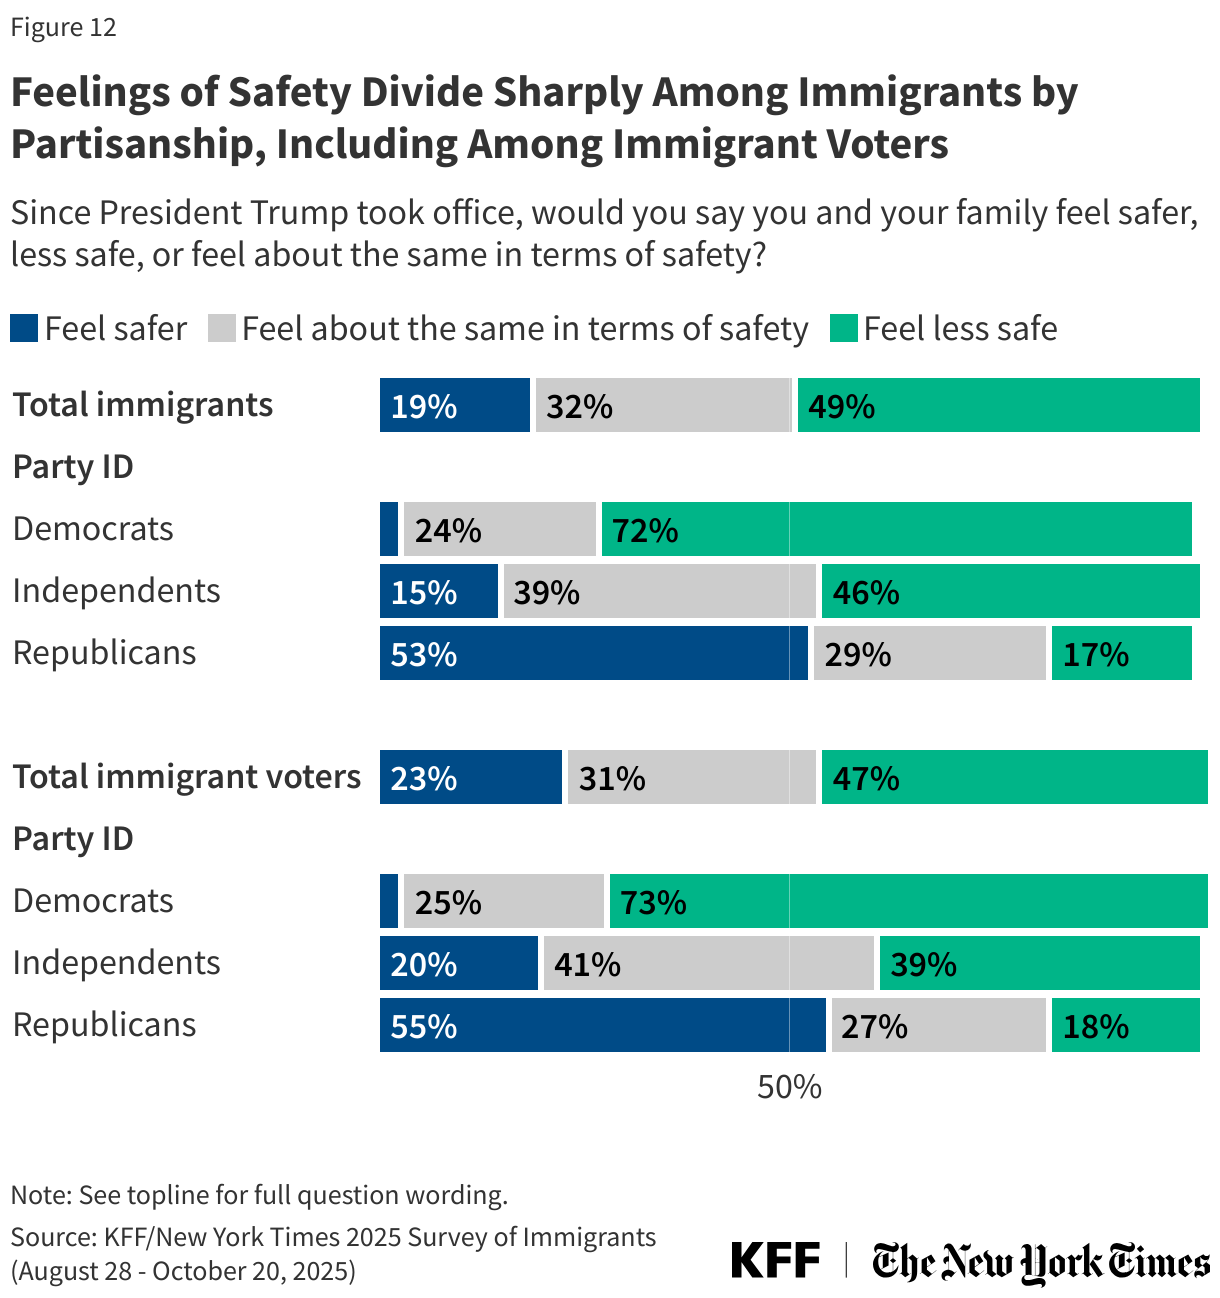
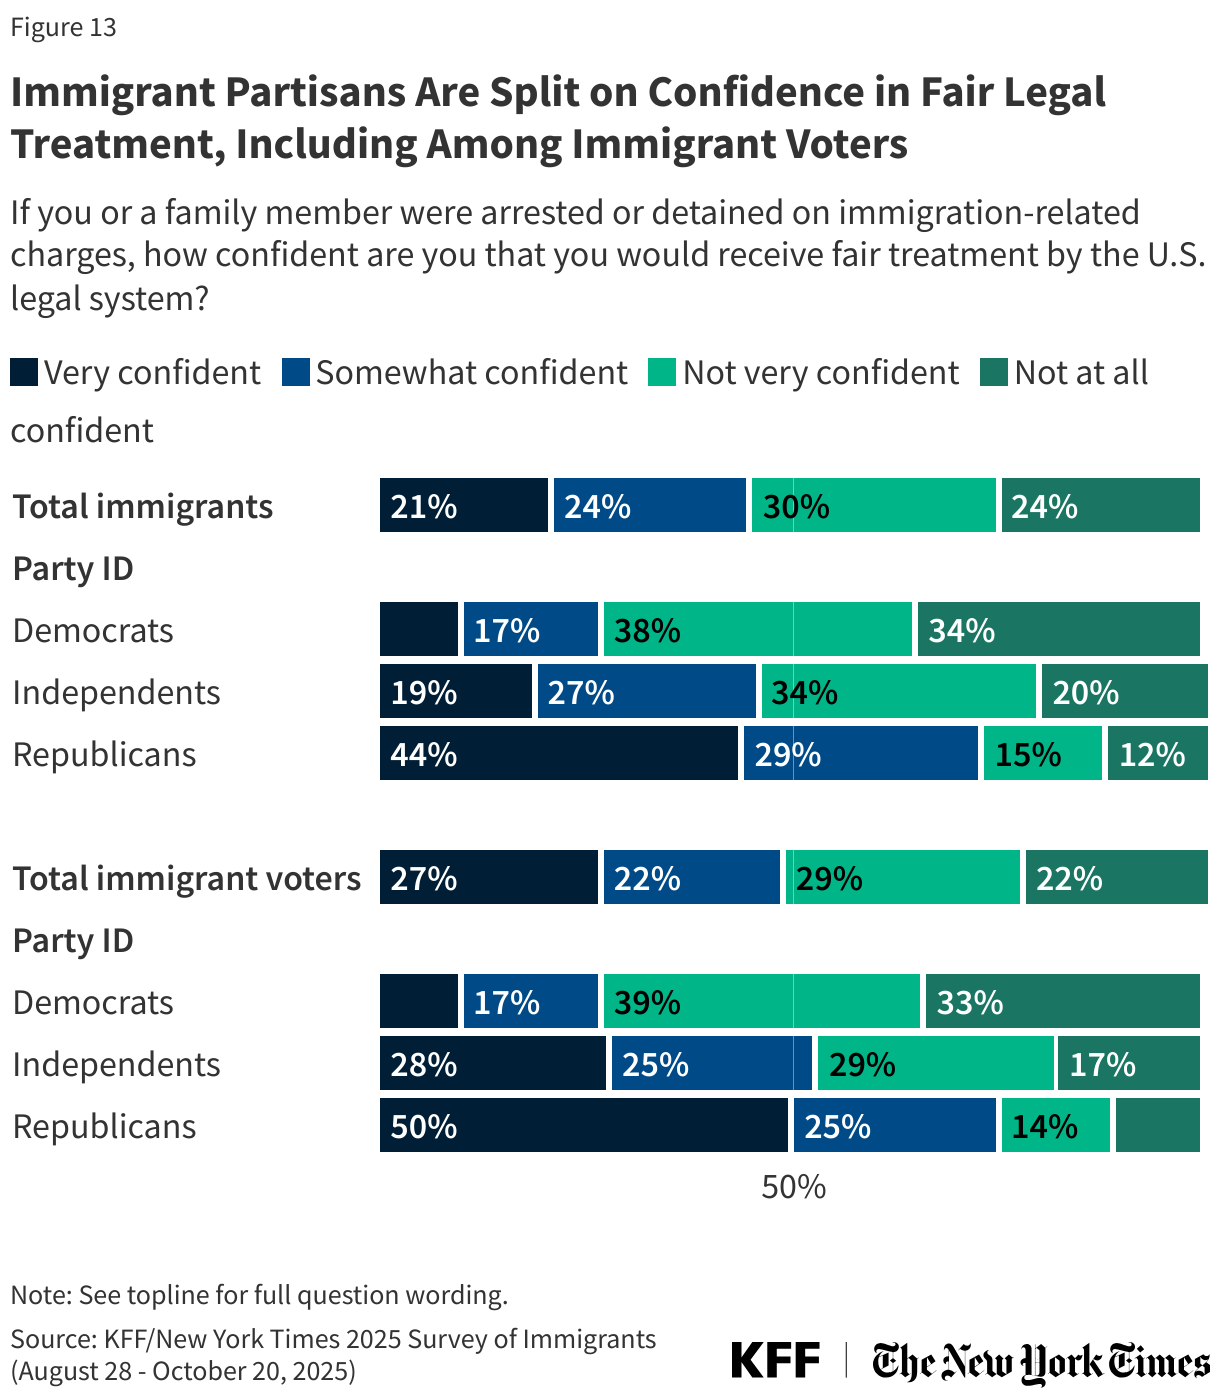
- Immigrants’ feelings of safety and their confidence in the U.S. justice system are also shaped by partisanship. At least half of Republican immigrants (including those who are registered to vote) say they feel safer since President Trump took office and are confident they or a family member would be treated fairly by the justice system if detained for immigration-related reasons. At the same time, majorities of immigrants and immigrant voters who align with the Democratic Party say they feel less safe under President Trump and are not confident they would get fair treatment if detained.
Who Are Immigrant Voters?
Six in ten immigrant adults are U.S. citizens, and 89% of this group (53% of all immigrant adults) report that they are registered to vote. While precise estimates of how naturalized citizens voted in the 2024 presidential election are not readily available, several analyses suggest that Hispanic and Asian voters overall have been shifting away from the Democratic Party and towards Republicans in recent elections.
When it comes to partisan identity, a larger share of immigrants say they consider themselves Democrats than Republicans, but about half of all immigrants, including about four in ten registered immigrant voters, say they are either independent or that they don’t identify with either major U.S. political party.
Views of President Trump’s Job Performance Among Immigrant Voters
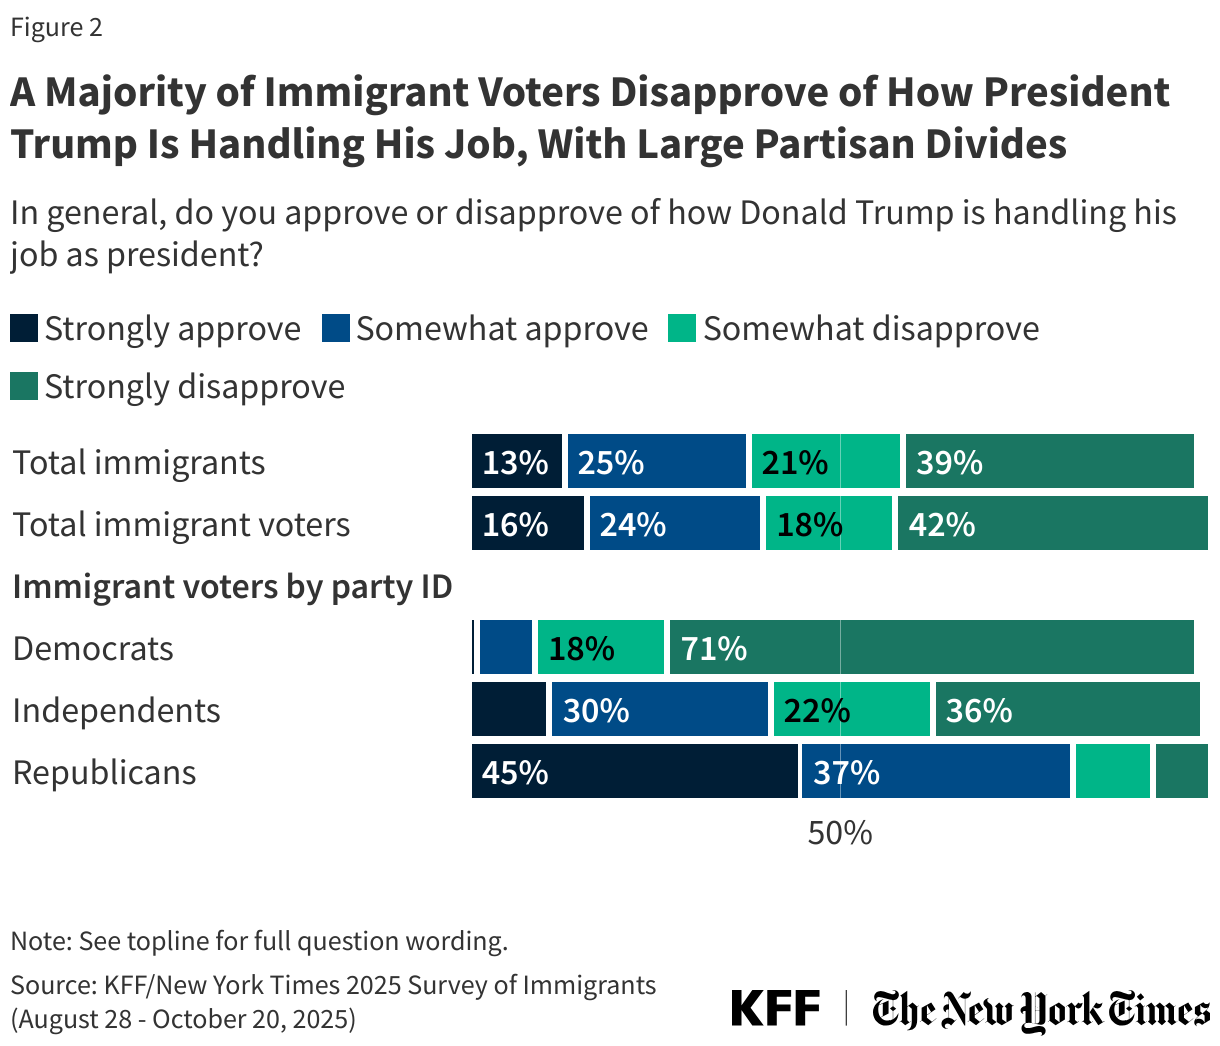
Six in ten immigrant voters disapprove of President Trump’s handling of his job as president, including four in ten (42%) who strongly disapprove. Views of the president’s performance vary by partisan identification among immigrant voters, with eight in ten (81%) Republicans approving and nine in ten Democrats disapproving. Disapproval is stronger than approval among partisans; seven in ten (71%) Democratic immigrant voters strongly disapprove of Trump’s performance while fewer than half (45%) of Republicans strongly approve.
These results are similar to views of the broader public, with recent polling averages finding over half the public disapproves of the president’s performance while about four in ten approve.
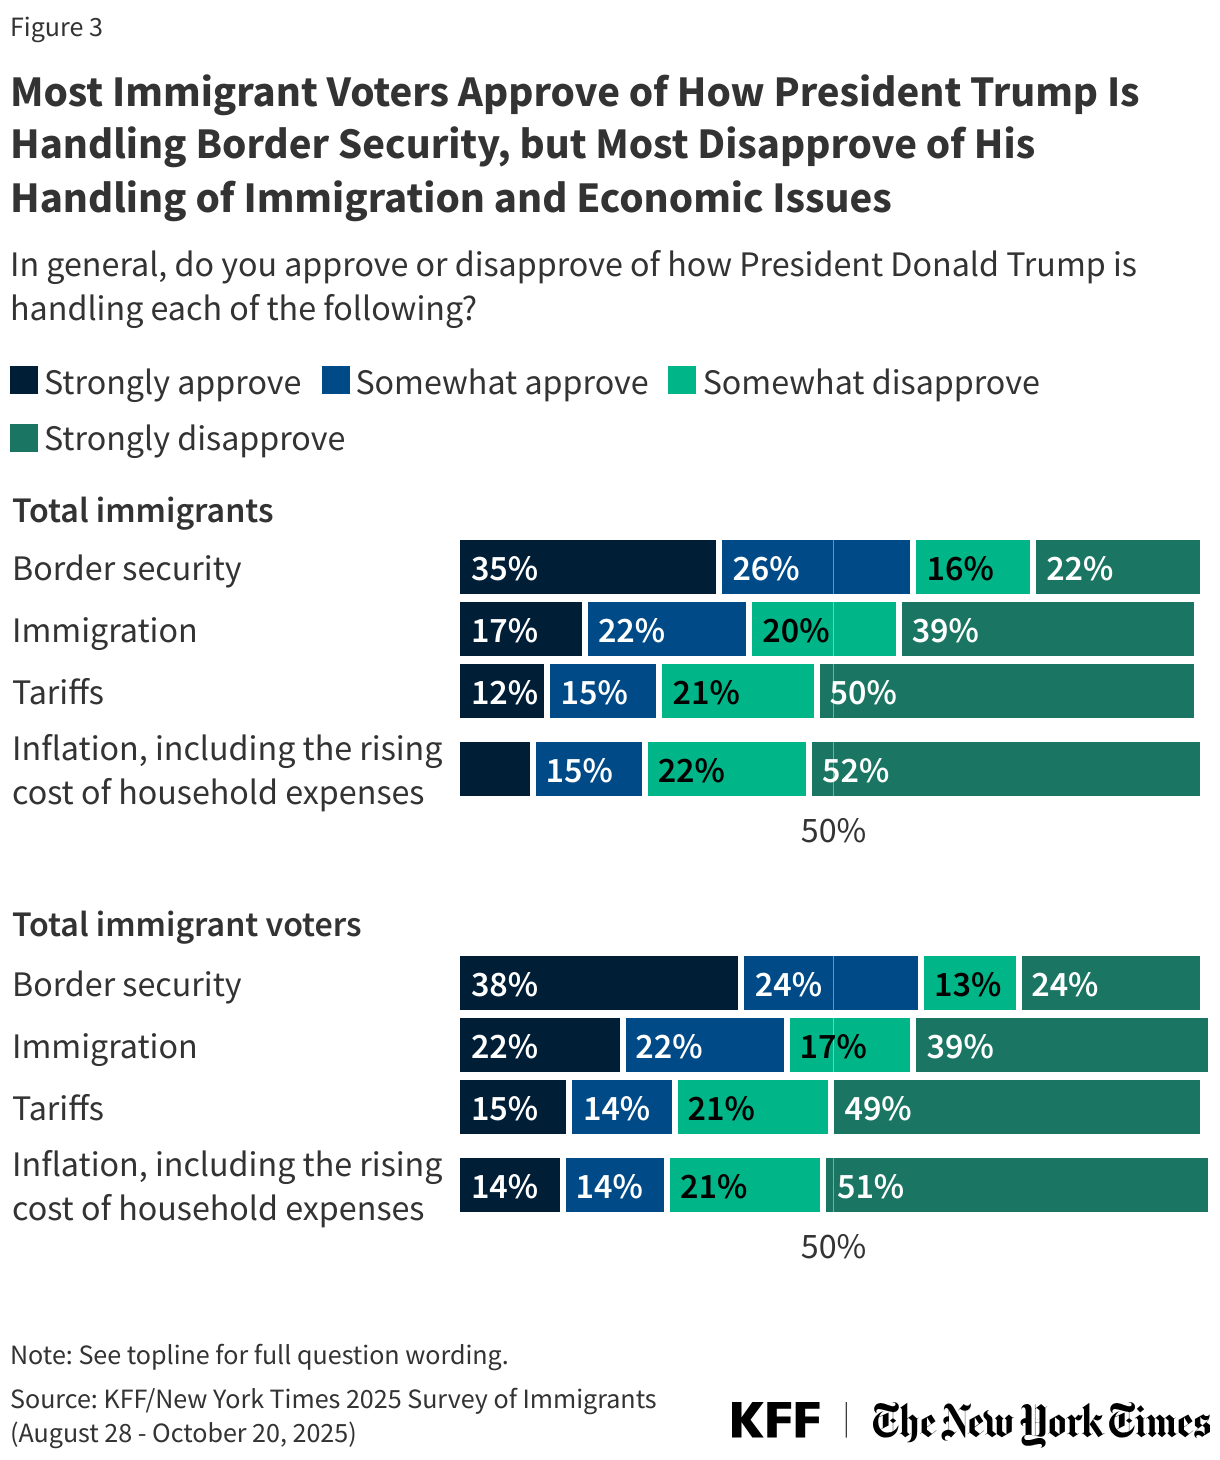
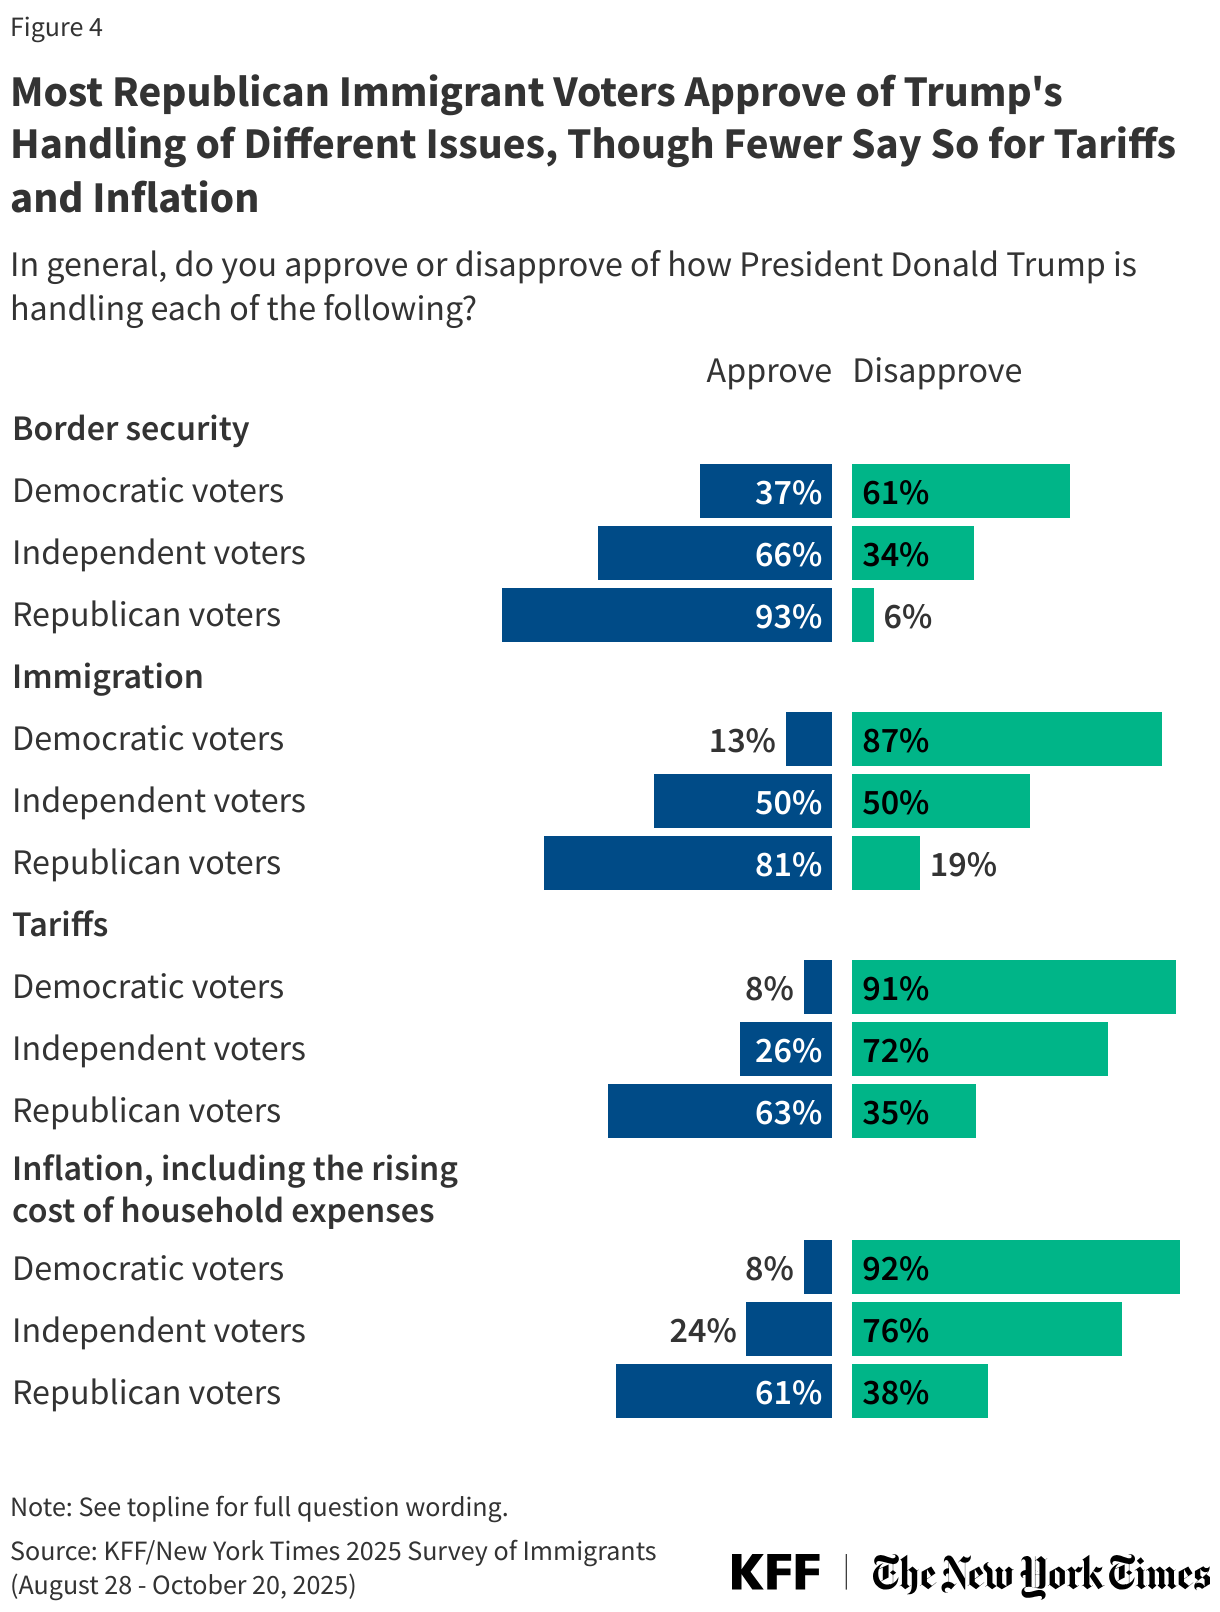
President Trump’s worst ratings are for his handling of economic issues, while views of his handling of immigration and border security are more mixed among immigrant voters. Seven in ten immigrant voters disapprove of the way President Trump is handling inflation (72%) and tariffs (69%), including about half who “strongly disapprove” of his handling of each of these areas. On the other hand, most immigrant voters (62%) approve of the president’s handling of security at the southern border, while nearly four in ten (37%) disapprove.
A majority (56%) of immigrant voters disapprove of the president’s handling of immigration policy more broadly, though a substantial 44% approve. Views of the president’s handling of immigration are similar among immigrant voters as they are among registered voters overall in a recent New York Times/Sienna Poll (52% disapprove, 46% approve). However, a smaller share of immigrant voters strongly approve of Trump’s handling of immigration compared to voters overall (22% vs. 35%).
Republican immigrant voters largely approve of President Trump’s handling of immigration, while a large share of Democrats disapprove and independents are split. President Trump’s lowest ratings across partisan groups are on handling of the economy. For example, large shares of Republican immigrant voters approve of how President Trump is handling border security (93%) and immigration (81%), but smaller majorities approve of how he is handling tariffs (63%) and inflation (61%). Large majorities of Democratic immigrant voters disapprove of the president’s performance in each of these areas, though nearly four in ten (37%) approve of how Trump is handling border security.
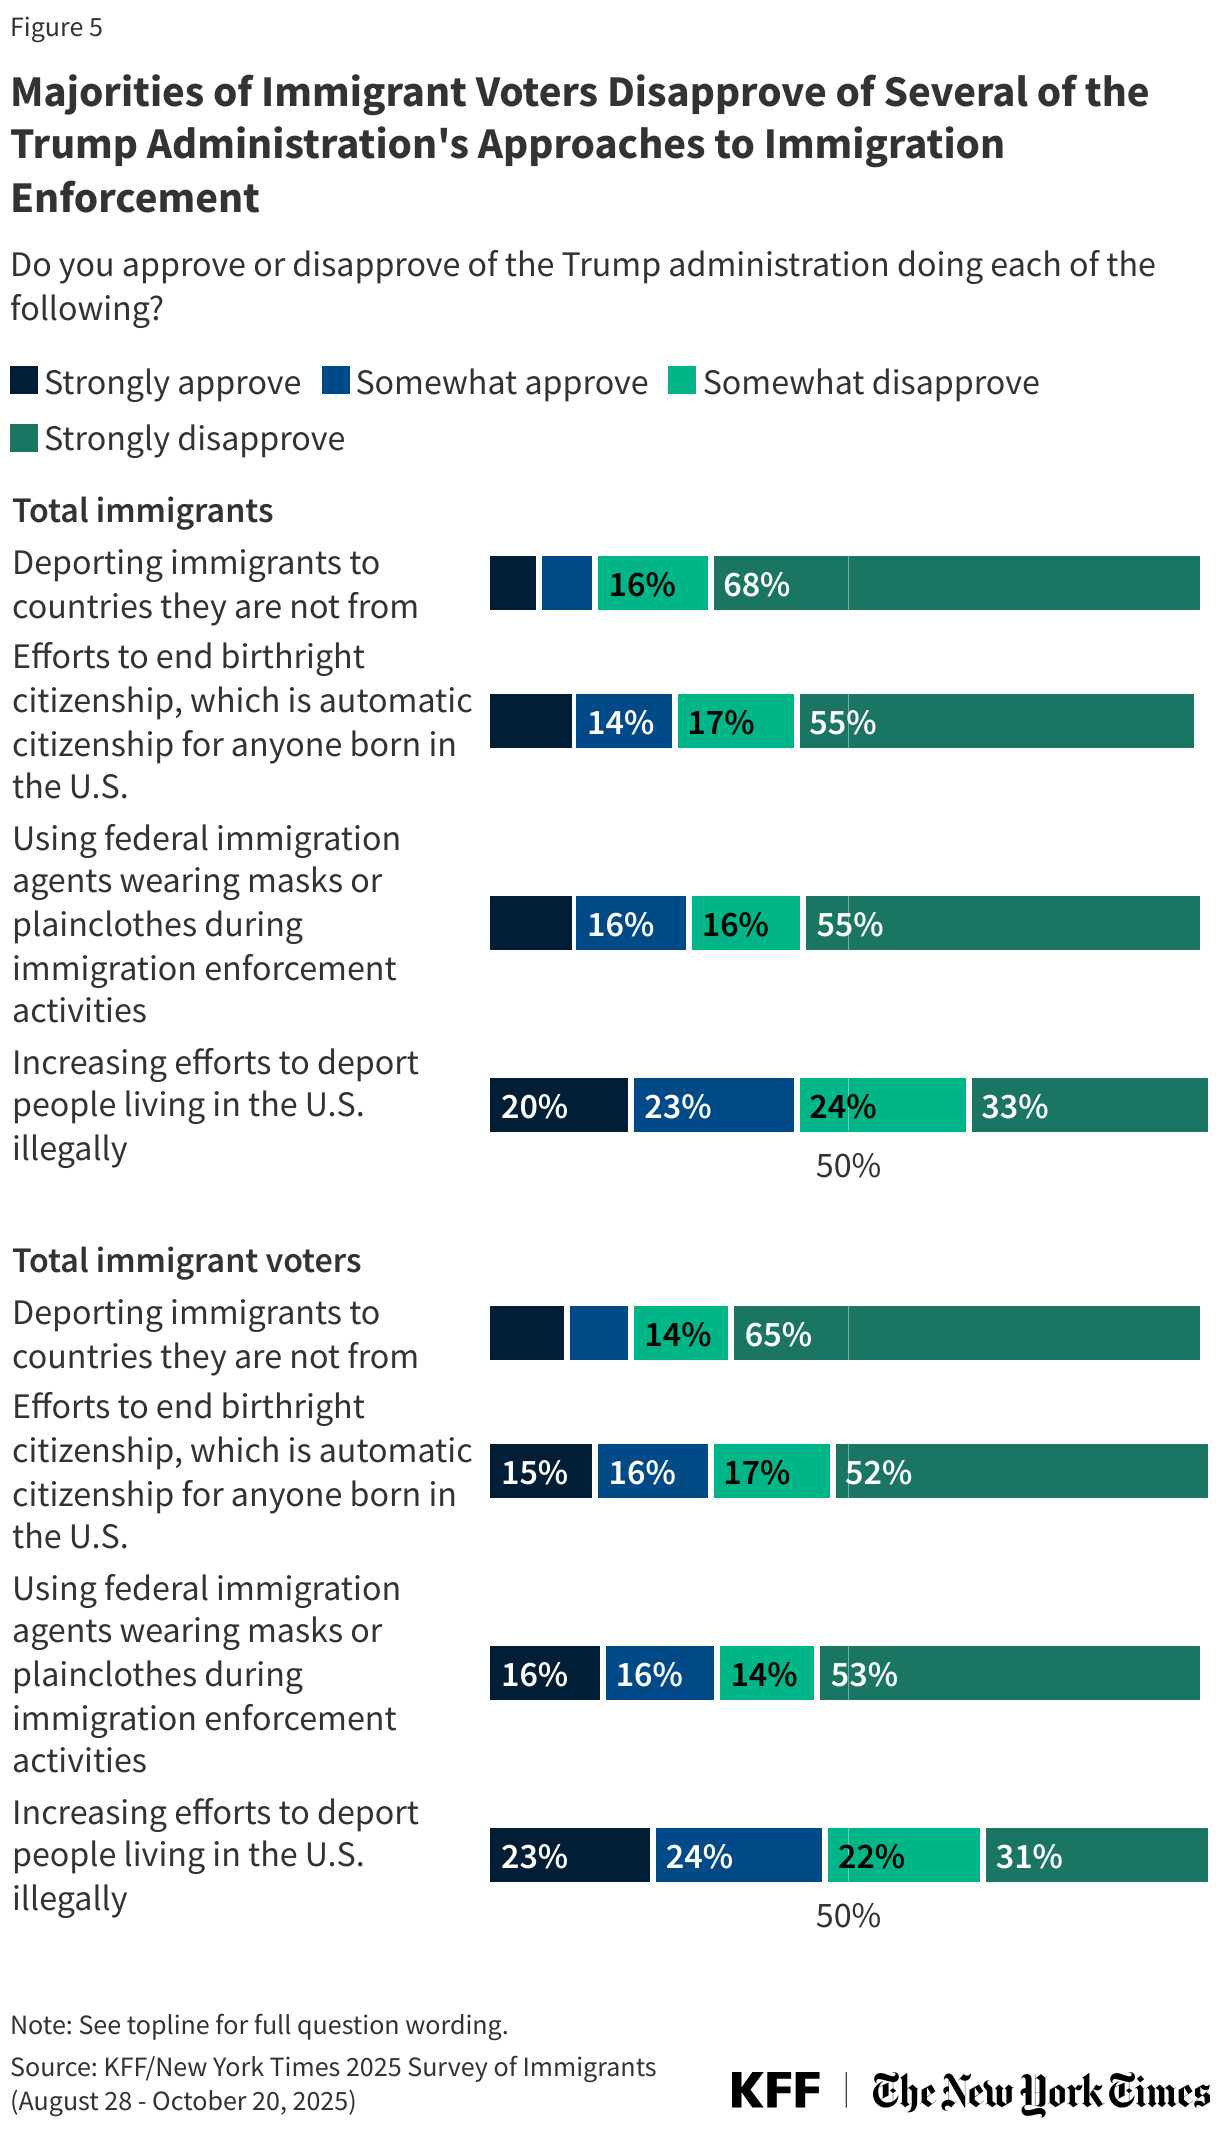
Despite being mixed on President Trump’s handling of immigration and border security generally, most immigrant voters disapprove of many of the administration’s immigration enforcement actions. This includes large majorities who disapprove of the Trump administration deporting immigrants to countries they are not from (80%), efforts to end birthright citizenship (69%), and having federal immigration agents wearing masks or plainclothes during immigration enforcement activities (67%). Fewer, though still about half (53%), disapprove of the administration increasing efforts to deport more people living in the U.S. illegally.
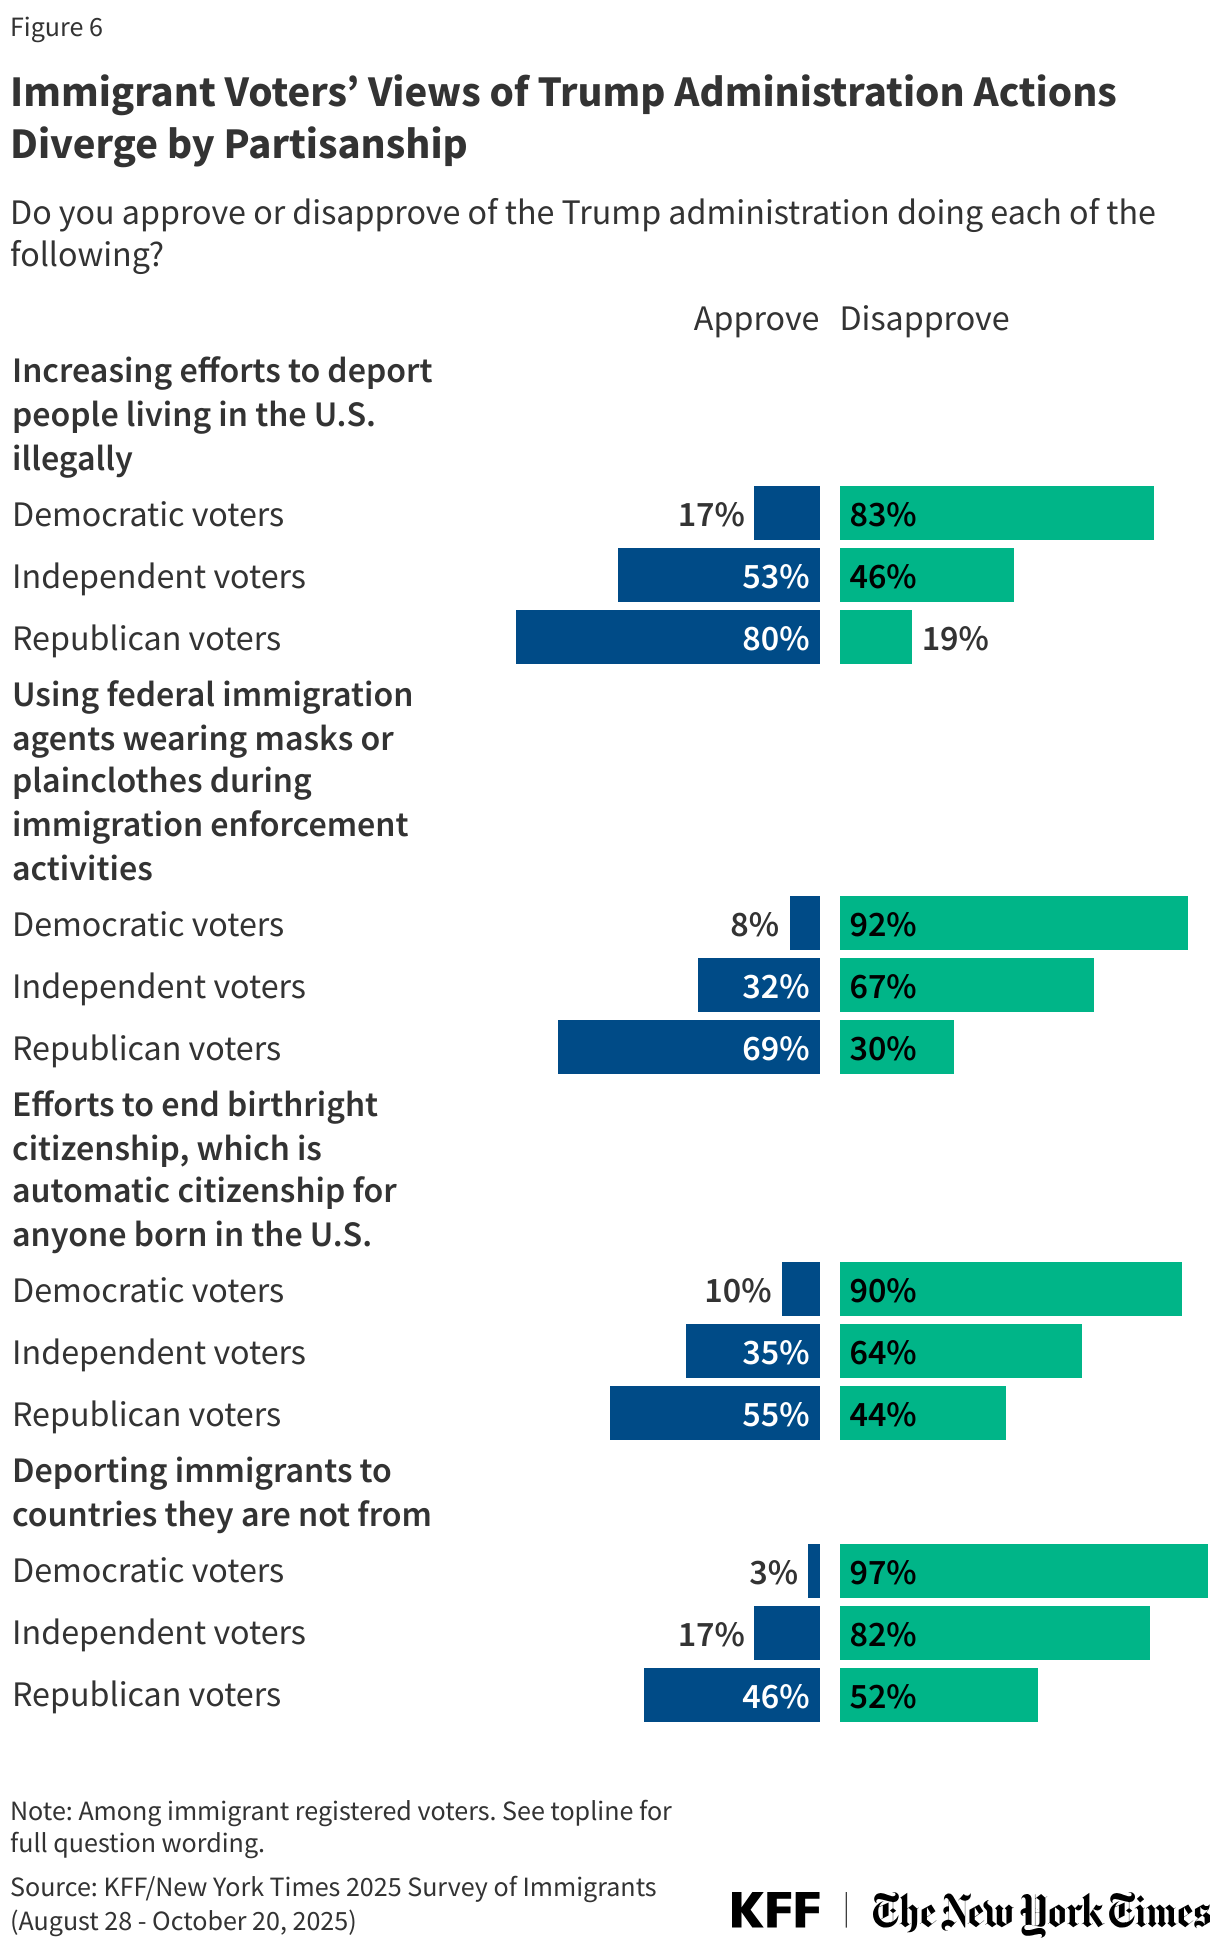
Immigrant voters’ views of the Trump administration’s immigration enforcement actions diverge by partisanship, though approval among Republican immigrant voters is not universal. While majorities of Republican immigrant voters support many of the administration’s actions, half (52%) disapprove of deporting immigrants to countries they are not from, and more than four in ten (44%) disapprove of efforts to end birthright citizenship. Republican immigrant voters are about four times as likely as Democrats to say they approve of efforts deport more people living in the U.S. illegally (80% vs. 17%) and eight times as likely to approve of federal immigration agents wearing plainclothes or masks during enforcement activities (69% vs. 8%). Majorities of independent and Democratic immigrant voters disapprove of each of these actions by the administration (with the exception of increasing deportations of undocumented immigrants, on which independents are narrowly divided).
For the most part, immigrant voters’ views of President Trump’s immigration policies are not vastly different from those of the general population. For example, a June 2025 Pew Research Center survey found two-thirds of the public said it was “unacceptable” to “deport immigrants in the U.S. illegally to a different country if they cannot return to their home country,” with most Democrats finding this unacceptable and Republicans more evenly divided.
Immigrant voters’ views diverge somewhat from the broader public on the question of birthright citizenship. Seven in ten (69%) immigrant voters disapprove of efforts to end birthright citizenship, compared to 56% of U.S. adults overall in a February 2025 Pew Research Center survey. Notably, while 72% of Republicans overall approve of efforts to end birthright citizenship, this is lower (55%) among Republican immigrant voters.
Views of Immigration Enforcement
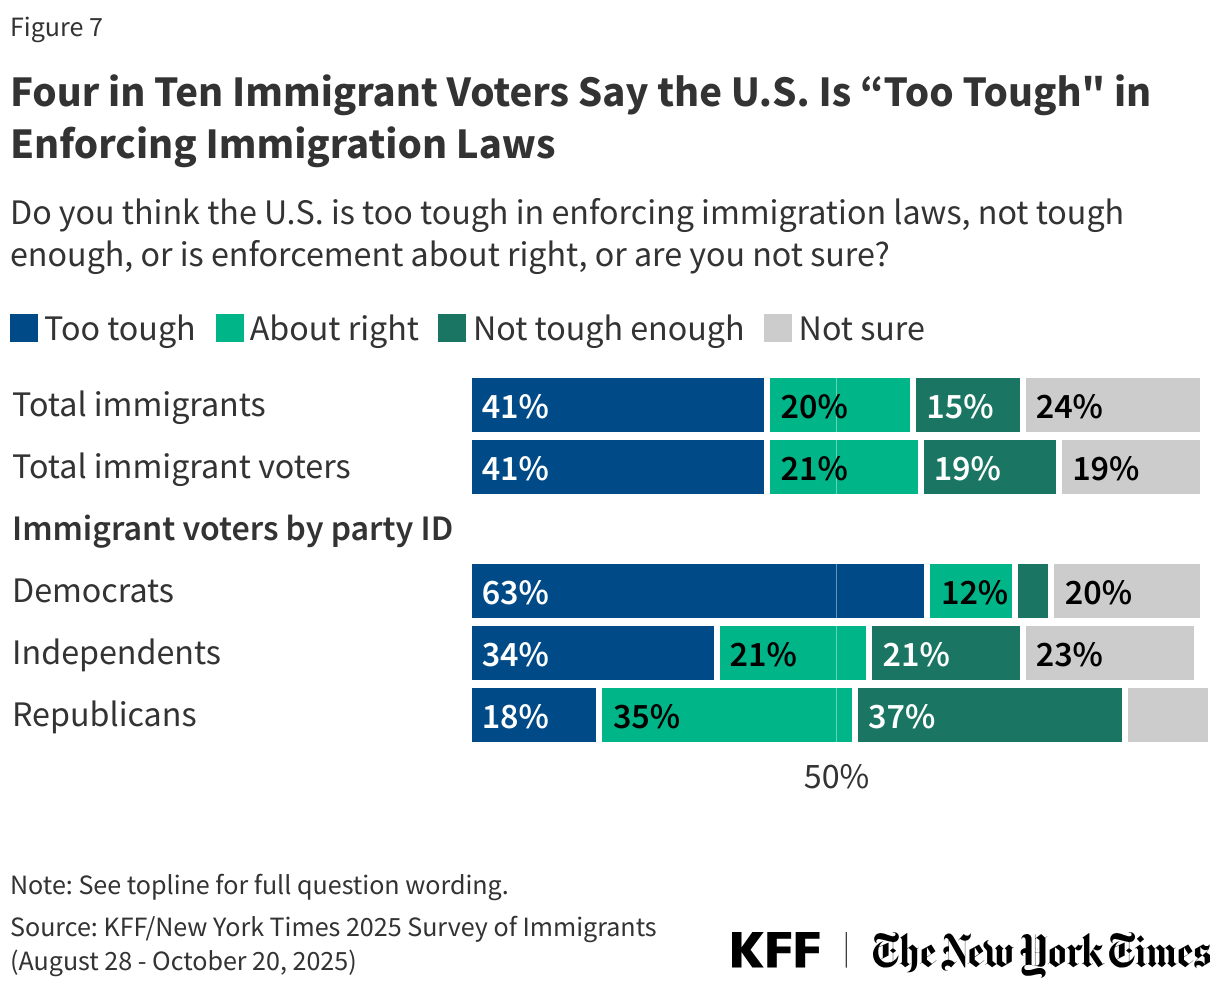
Four in ten (41%) immigrant voters say the U.S. is “too tough” in enforcing immigration laws, though these views are largely divided by partisanship. Most immigrant voters who identify as Democrats say U.S. immigration enforcement is “too tough” (63%), while most Republicans say it is “not tough enough” (37%) or “about right” (35%). Among independent immigrant voters, one-third (34%) view U.S. immigration enforcement as too tough, but four in ten see it as either about right (21%) or not tough enough (21%). Notably, about one in five (19%) immigrant voters say they are not sure how to answer this question.
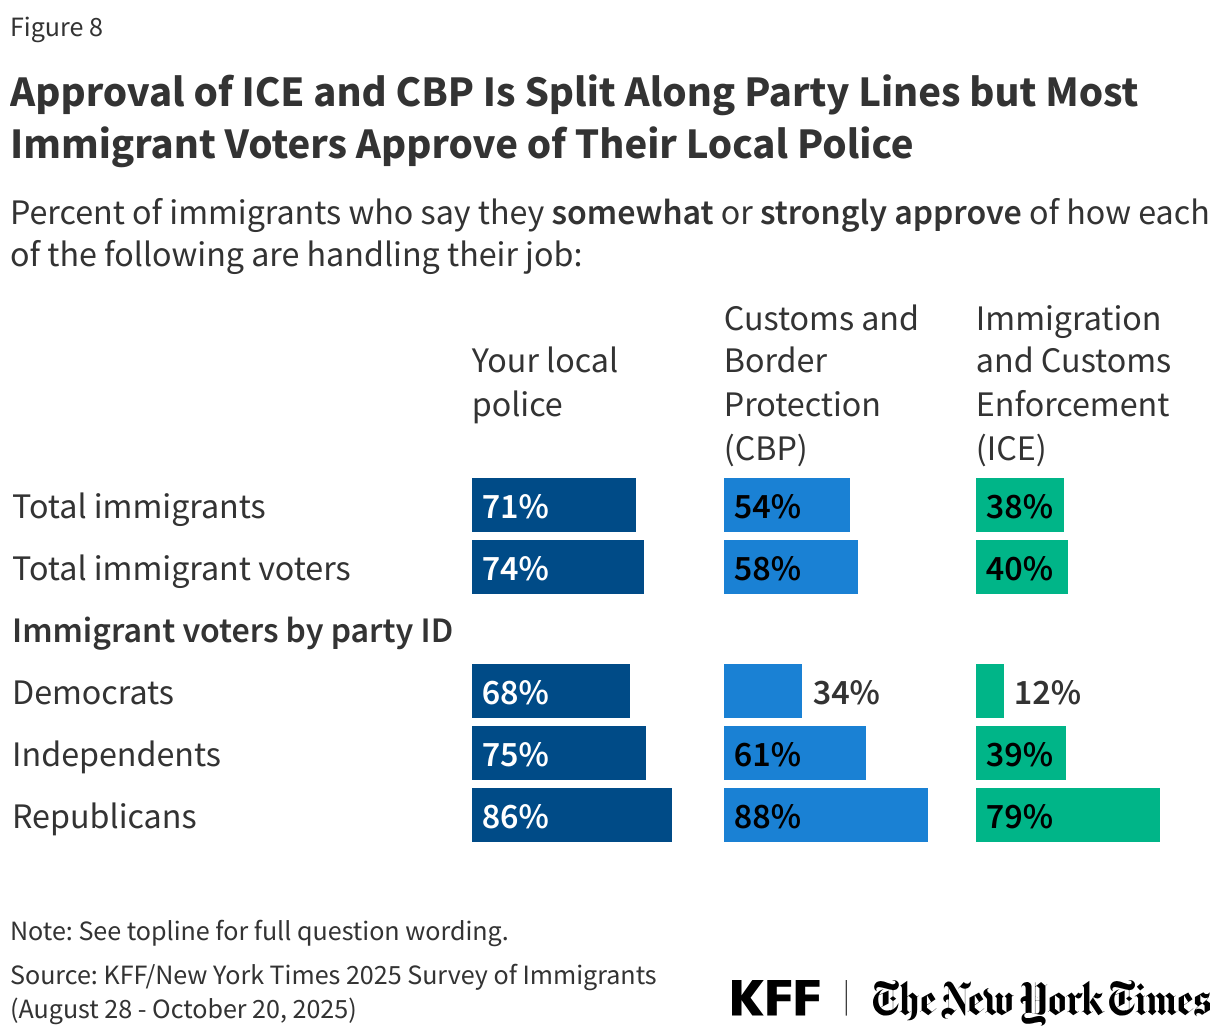
While most immigrant voters across partisanship feel positively toward their local police, approval of Immigration and Customs Enforcement (ICE) and Customs and Border Protection (CBP) divide sharply by partisanship. Overall, six in ten (59%) immigrant voters disapprove of how ICE is handling their job, while a similar share (58%) approve of the performance of Customs and Border Protection (CBP). These views diverge by partisanship, with majorities of Democratic immigrant voters disapproving of both agencies and majorities of Republicans approving. Across party identification, majorities of immigrants say they approve of how their local police are handling their job.
About half (49%) of immigrant voters say they are “angry” about what is happening with immigration enforcement in the U.S. and about four in ten (39%) say they are “afraid,” but nearly half (46%) say they feel the current immigration enforcement “is necessary,” including eight in ten Republican immigrant voters. Despite the large share saying they feel enforcement is necessary, far fewer immigrant voters say they feel “satisfied” (28% overall, 59% among Republicans) or “proud” (19% overall, 42% of Republicans) when it comes to what is happening with immigration enforcement in the U.S. today.
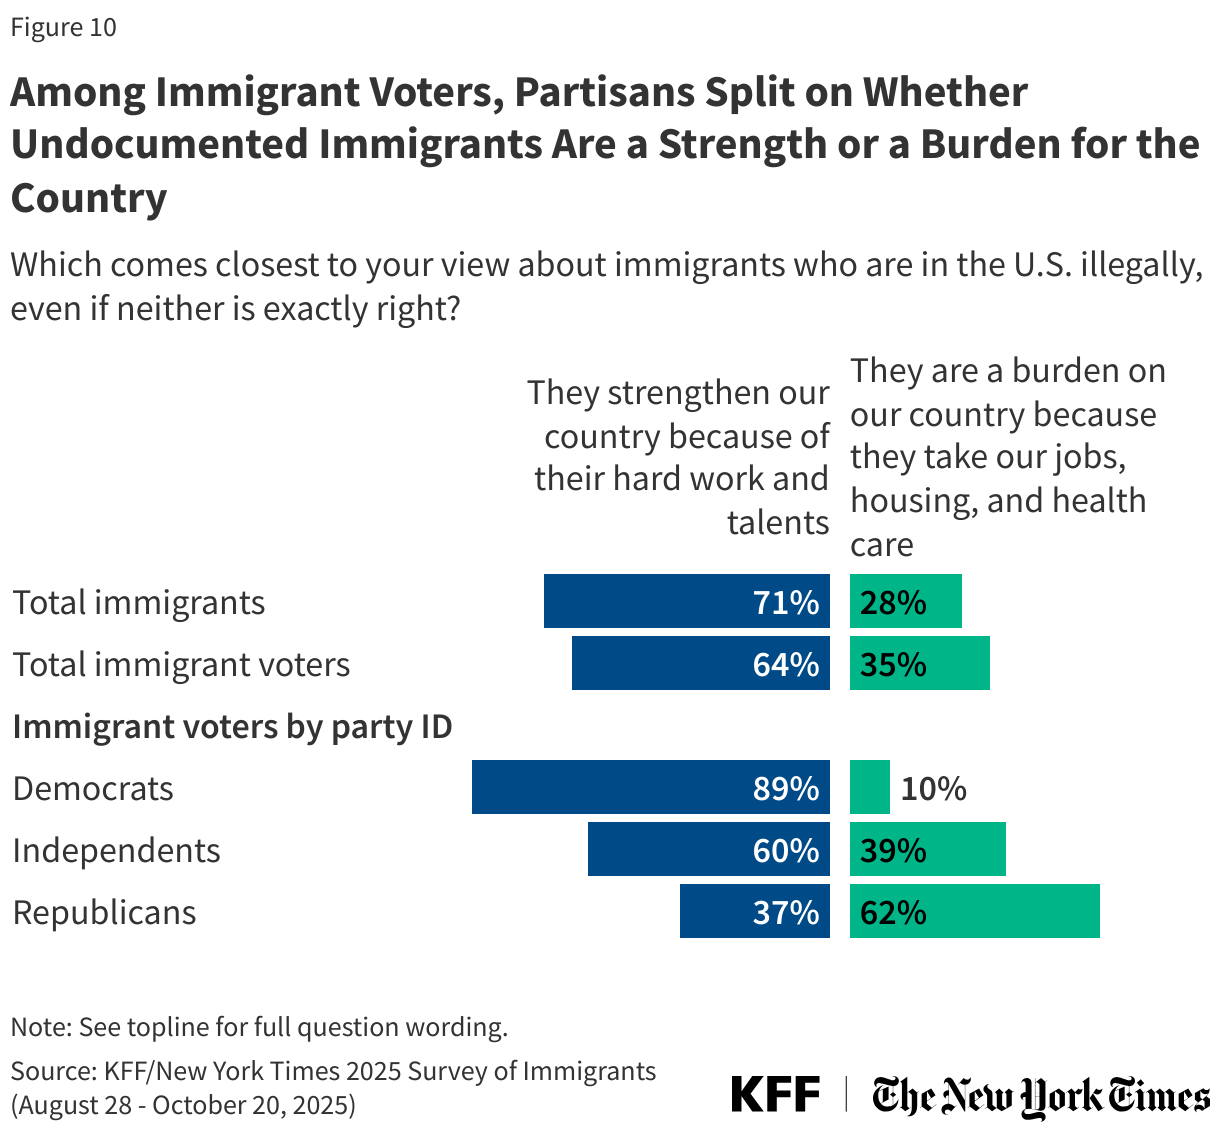
Immigrant voters’ views on the Trump administration’s immigration enforcement policies may be related to their broader views on undocumented immigrants, including whether they view such immigrants as a strength or a burden. Two-thirds (64%) of immigrant voters say immigrants who are in the U.S. illegally “strengthen our country because of their hard work and talents,” while about a third (35%) say “they are a burden on our country because they take our jobs, housing, and health care.” While nine in ten (89%) immigrant voters who are Democrats and six in ten who are independents say immigrants living in the U.S. illegally are a strength, most Republican immigrant voters (62%) view them as a burden.
Political Implications
Nearly six in ten (57%) immigrant voters say their views on the Trump administration’s immigration policies have had an impact on which political party they support, including over four in ten (44%) who say they have had a “major impact.” Similar shares of those who identify as Democrats (65%) and Republicans (62%) say the Trump administration’s immigration policies have had either a “major” or “minor” impact on the political party they support, while fewer (45%) independents say so.
When immigrant voters are asked to describe how the Trump administration’s immigration policies have impacted which political party they support, a larger share express views that reflect negative views of these policies or a shift away from Republicans (36%) than express views in support of these policies or the Republican party (19%). Others who say immigration policies have affected which party they support offer generally negative (6%) or generally positive comments (3%) or express negative views of both the Republican and Democratic parties (3%).
In Their Own Words: Please describe how the Trump administration’s immigration policies impacted which political party you support.
Shift away from Trump/Republicans or towards Democrats:
“I used to consider candidates from both parties, especially for local elections, and focused on the individual candidate’s merits. Now I would never vote GOP for any reason, that party is gone.” — 58-year-old Costa Rican immigrant man in New York
“I used to think Republican and Democratic parties were not too dissimilar but now, there is a clear divide because Republican party is one now catering to an autocrat and want to punish free speech, constitutional rights.” — 50-year-old Korean immigrant woman in California
“I, myself, am a registered Republican. However, that does not mean that I agree with Trump’s stance and actions on immigration. Because of his actions, I find myself leaning more towards the Democratic side.” — 67-year-old Filipino immigrant man in California
“I was born in a country that was taken over by a violent revolution by an authoritarian party. I now see the Trump administration doing things equally revolutionary and evil. I was once proud to vote for Republicans. Now I will never vote for another Republican ever again.” — 66-year-old Nicaraguan immigrant woman in Texas
“I used to be a registered Republican before Trump first term. I’m an independent now because of his immigration talk and policies.” — 59-year-old Mexican immigrant man in California
“The policies seem unnecessarily dehumanizing and heavy handed and have led me to question whether the Republican Party cares about people, American or otherwise.” — 45-year-old German immigrant man in Washington D.C.
“I used to align more with conservative views but it seems they are more concerned with cruelty than security.” — 21-year-old Iranian immigrant in Washington
“They made me support Democrats more.” — 32-year-old Indian immigrant woman in New York
“I consider myself a democrat however prior to the immigration stuff I was leaning toward the Republican Party but since I have withdrawn completely.” — 36-year-old Canadian immigrant man in California
Shift away from Democrats or toward Trump/Republicans:
“I supported Democrats until they left the border wide open. I worked very hard to get my citizenship and it’s sad to see people cut the line and get more support as illegal immigrants over me as a tax paying citizen.” — 43-year-old Mexican immigrant man in California
“I am strongly against illegal immigration, thus I support the Republican party in their efforts to fight it.” — 60-year-old Vietnamese immigrant woman in California
“Having a safer environment and more job opportunities due to Trump administration’s immigration policies made me stand more with the Republican Party.” — 87-year-old Filipino immigrant man in Texas
“Protecting our nation is very important, so I support Republican Party. Prior administration let in a lot of undocumented immigrants so I do not support Democratic party.” — 49-year-old Indian immigrant man in New Jersey
“I was independent but when I saw Trump’s policies, I went to the Republican party.” — 77-year-old Cuban immigrant woman in Florida
“The Democratic open borders changed my mind on who they were. I became a Republican, what they did was a crime against this country.” — 71-year-old German immigrant woman in Oregon
Increased frustration with both parties:
“Increased my anger [at] both parties. Republicans for supporting clear illegal decisions. Democrats for being wet noodles.” — 42-year-old Chinese immigrant man in Maryland
“His [Trump’s] complete disregard for the Constitution and the rule of law and the “yes men” of the Republican Party have not made me any more fond of the Democratic Party but have simply made me stop voting for the Republicans as well. We need a new party.” — 55-year-old Thai immigrant man in Texas
“I have been traditionally conservative, but the current polices are too far to the right whereas the Democrats are too far to the left. It seems there is no room left for moderates.” — 46-year-old Vietnamese immigrant woman in California
“I’ve become unaffiliated as his nuisances have led me to be more cautious of political options. I can’t strongly favor any party with the current political situation we’re in.” — 45-year-old Peruvian immigrant woman in New Jersey
Note: Responses are lightly edited for length and spelling, but reflect respondents’ own language and do not represent the views of KFF.
Feelings of Safety and Future Outlook
Immigrants who identify as Republican are much more likely to report feeling safe in the U.S. and to be confident they would receive fair treatment by the U.S. justice system. As reported in another report examining immigrants’ worries and experiences amid increased immigration enforcement, about half of immigrants overall say they feel less safe since President Trump took office, and most are not confident they or a family member would receive fair treatment by the U.S. legal system if arrested or detained on immigration-related charges. Looking by partisanship, immigrants who identify as Democrats are much more likely to report feeling less safe and to lack confidence they would be treated fairly by the justice system compared to those who identify as Republicans. This pattern holds among immigrants overall as well as among those who are registered to vote.
For example, over half (55%) of Republican immigrant voters say they feel safer since President Trump took office and three-quarters are “very” or “somewhat confident” they would get fair treatment by the U.S. justice system. In contrast, nearly three-quarters (73%) of Democratic immigrant voters report feeling less safe under the Trump administration and seven in ten (72%) are “not very” or “not at all confident they would be treated fairly by the justice system. Among immigrant voters who identify as independents, about four in ten (39%) report feeling less safe since Trump took office while a similar share (41%) say they feel “about the same” in terms of safety. Independent immigrant voters are also split on whether they would receive fair treatment, with about half (54%) very or somewhat confident and the other half (46%) not confident.
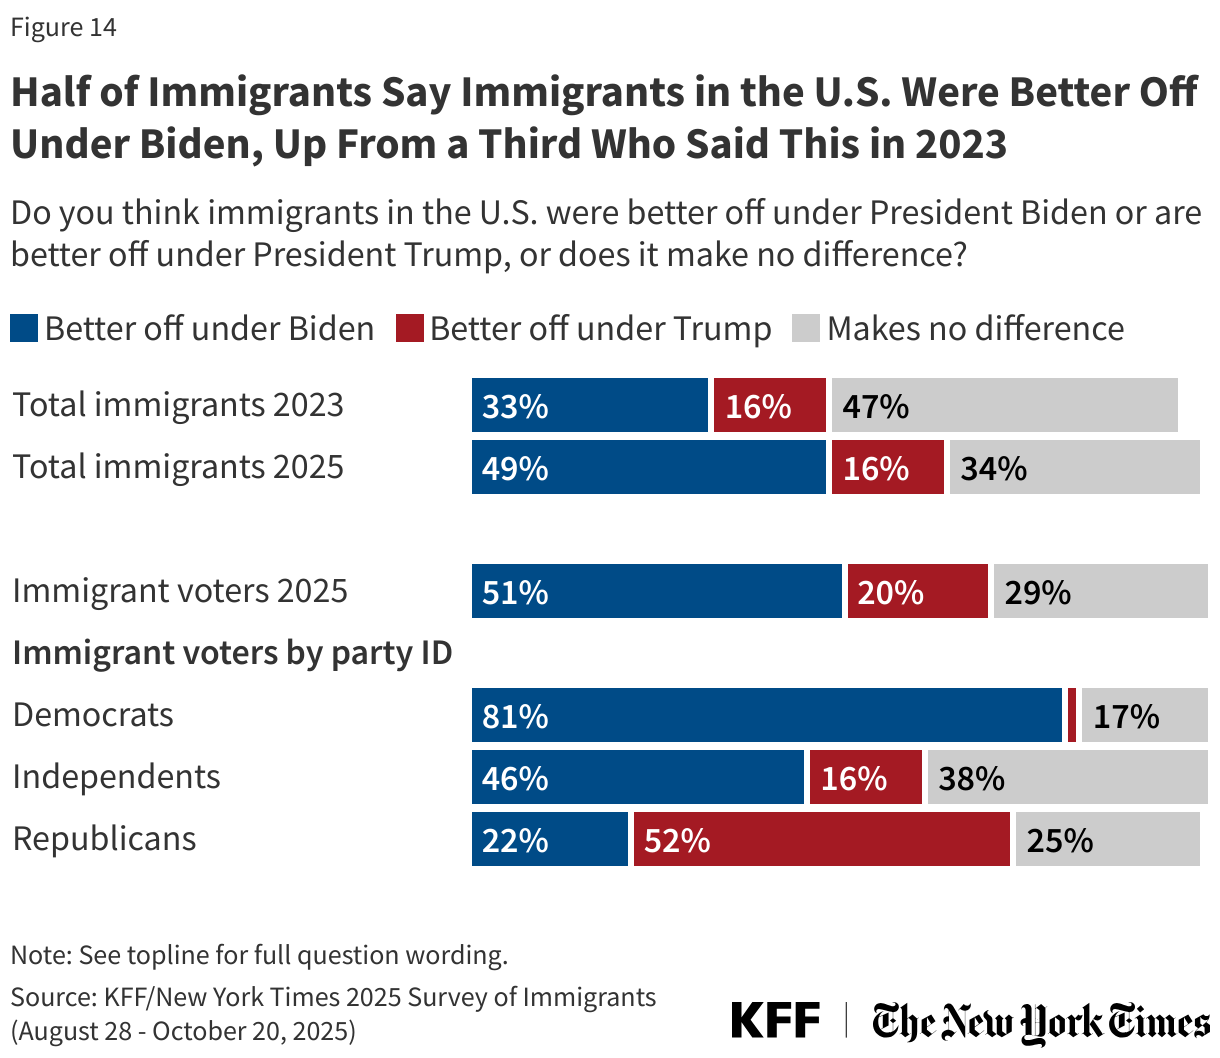
Amid negative views of current immigration policies, a larger share now than in 2023 say immigrants were better off under President Biden than President Trump. Half (49%) of immigrants overall now say immigrants in the U.S. were better off under President Biden than President Trump, up from a third who said the same in 2023. While the share saying immigrants are better off under President Trump hasn’t changed (16%), the share who say it makes no difference for immigrants who is president declined from about half (47%) in 2023 to one third (34%) in 2025.
These views diverge predictably by partisanship among immigrant voters, but a notable 22% of Republican immigrant voters in 2025 say immigrants were better off under President Biden and another quarter say it makes no difference.
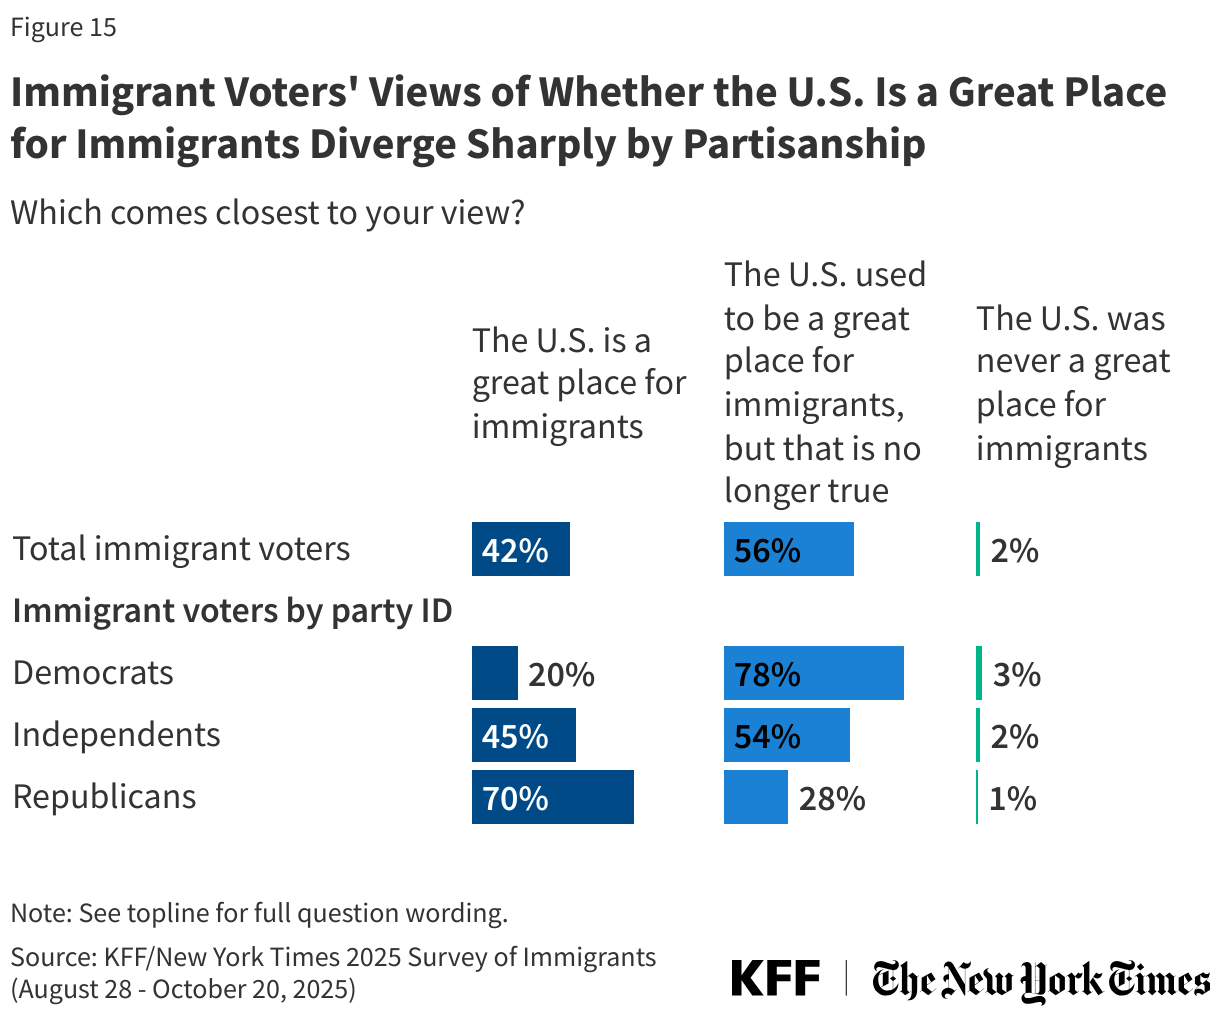
The question of whether the U.S. is still a great place for immigrants is viewed largely through a partisan lens. While seven in ten Republican immigrant voters say the U.S. is a great place for immigrants, eight in ten (78%) immigrant voters who are Democrats say the U.S. used to be a great place for immigrants but that is no longer the case. Independent immigrant voters are more divided, with close to half (45%) viewing the U.S. as a great place for immigrants and slightly more than half (54%) saying that used to be true but is no longer the case.