


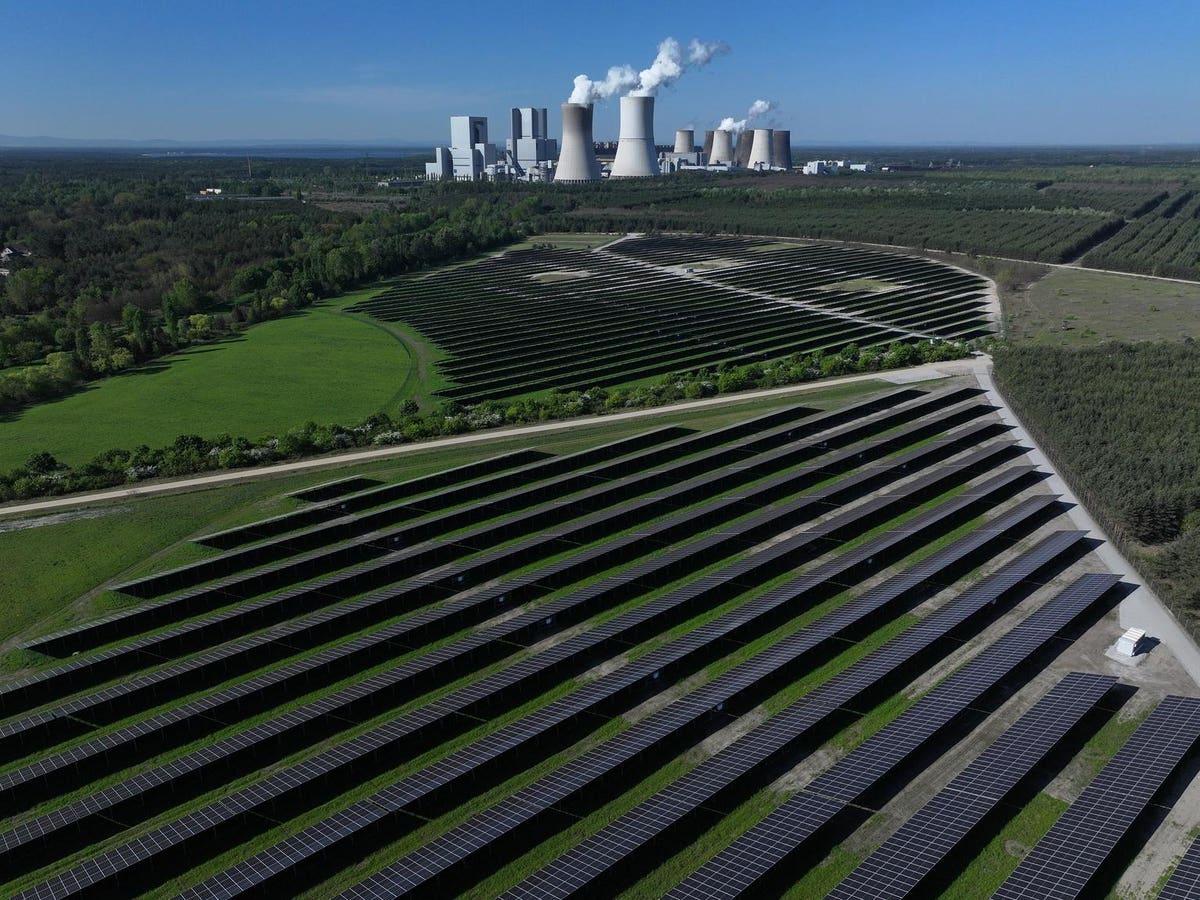
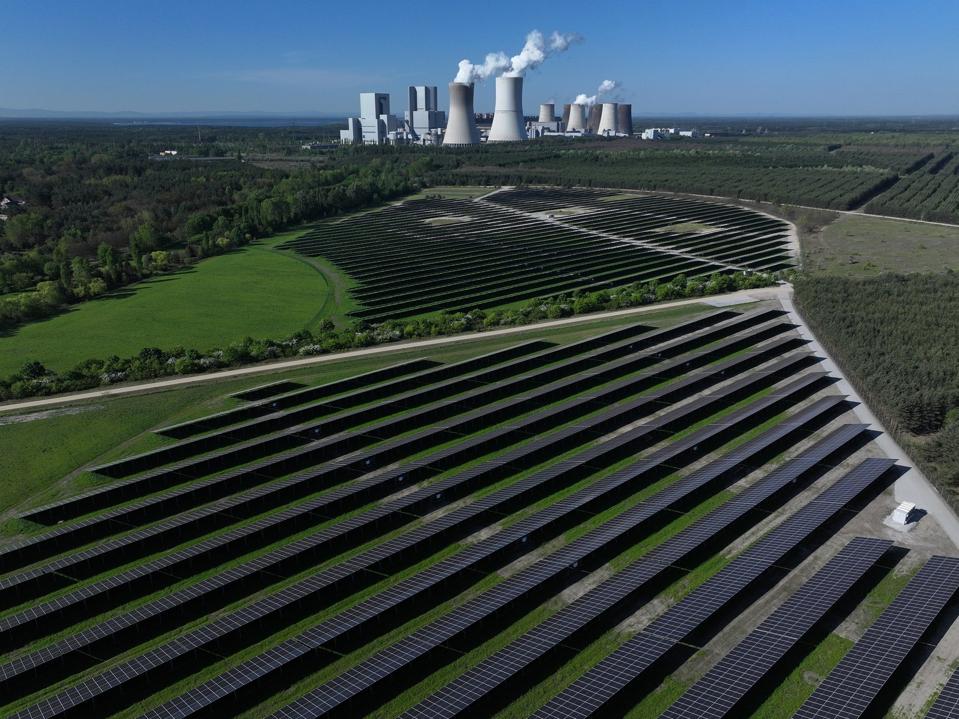
NOCHTEN, GERMANY – APRIL 30: In this aerial view the Boxberg coal-fired power plant stands behind … More
This week the Energy Institute (EI) released the 2025 Statistical Review of World Energy, which was published previously for more than 70 years by BP.
The full report and all data can be found at this link.
The Statistical Review is instrumental in providing comprehensive data on global oil, gas, and coal production and consumption, as well as on carbon dioxide emissions and renewable energy statistics.
Over the next month, I will delve into the various categories from the report. But today, I want to highlight a foundational change in how global energy supply is measured—along with a few key findings that set the stage for what’s to come.
Total Energy Supply
The 2025 edition marks a major shift in how global energy supply is calculated. For decades, the industry relied on “Primary Energy Consumption” as a benchmark.
That’s now changing. The Statistical Review—citing the methodologies used by the International Energy Agency (IEA), U.S. Energy Information Administration (EIA), BP, and Eurostat—has adopted a metric called Total Energy Supply (TES).
So, what is TES, and why does it matter?
In a nutshell, Total Energy Supply reflects the actual amount of energy available to meet a country’s demand. It accounts for production and imports, subtracts exports and storage, and adjusts for losses during conversion and transmission. It captures the energy that reaches end users in a usable form—whether that’s electricity, gasoline, or thermal energy.
The older method used for primary energy calculations tended to treat all energy sources as if they had the same conversion losses. For example, fossil fuels may be burned to generate electricity, but a significant portion of that energy is lost as heat in the process. Non-combustible renewables like wind, solar, nuclear, and hydro don’t incur those same losses. Yet under the old method, those renewables were still penalized with assumed inefficiencies, making their contribution appear smaller than it actually was.
By contrast, TES offers a more apples-to-apples comparison. It gives a truer sense of how much useful energy is actually delivered to society. This is particularly important as countries transition away from combustion-based energy and toward more direct-use sources like electricity from wind and solar.
An Illustrative Example
Some may view this change as an attempt to exaggerate the progress of renewables. Others may not understand what this definition change really entails. Thus, a simplified example may help.
Suppose a country burns 1 million barrels of oil to generate electricity in a year. Due to conversion losses, only about 40% of that energy makes it to the grid. Under the old system, all 1 million barrels were counted as primary energy, even though the usable output was far less.
Now imagine that same country uses wind power to generate the equivalent 400,000 barrels’ worth of electricity. Under the old approach, analysts would reverse-engineer how much oil that displaced and also credit wind with 1 million barrels of primary energy—treating it like oil to keep the comparison consistent.
Under TES, both sources are measured based on actual usable output. In this example, oil and wind each contribute 400,000 barrels’ worth of delivered energy. It’s a more consistent, technology-neutral reflection of what is really powering the system.
Some skeptics may view this change as an attempt to inflate the contribution of renewables, but in reality, it removes distortions that previously exaggerated fossil fuel inputs. The authors of the Statistical Review concluded that TES offers a better lens for measuring the true structure and direction of the global energy system.
Highlights of the 2025 Statistical Review
Global energy demand rose by 2% in 2024, reaching a new all-time high. In fact, every major energy source—coal, oil, gas, renewables, hydro, and nuclear—hit record levels of consumption.
Electricity demand outpaced overall energy growth at 4%, reinforcing the growing shift toward electrification. Meanwhile, wind and solar power expanded by 16%, driven primarily by China, which accounted for 57% of all new additions. Global solar capacity has nearly doubled in just two years.
But the broader picture is more complicated. Fossil fuel use also increased—albeit modestly—demonstrating that while clean energy is growing fast, it’s being layered on top of rising demand, not yet replacing conventional sources at scale.
Global carbon dioxide emissions rose another 1% in 2024, marking the fourth consecutive annual record. It’s a sobering reminder that despite extraordinary progress in renewable deployment, the world is still struggling to decouple economic growth from emissions.
Looking Ahead
This edition of the Statistical Review highlights a central tension of the energy transition: we’re building more clean energy than ever before, but we’re not yet letting go of the old.
Over the coming weeks, I’ll take a closer look at trends in oil, gas, coal, renewables, and emissions—providing deeper insight into what’s driving growth, what’s slowing it down, and where the world’s energy trajectory may be headed next.
