

Amazon SageMaker HyperPod now provides a comprehensive, out-of-the-box dashboard that delivers insights into foundation model (FM) development tasks and cluster resources. This unified observability solution automatically publishes key metrics to Amazon Managed Service for Prometheus and visualizes them in Amazon Managed Grafana dashboards, optimized specifically for FM development with deep coverage of hardware health, resource utilization, and task-level performance.
With a one-click installation of the Amazon Elastic Kubernetes Service (Amazon EKS) add-on for SageMaker HyperPod observability, you can consolidate health and performance data from NVIDIA DCGM, instance-level Kubernetes node exporters, Elastic Fabric Adapter (EFA), integrated file systems, Kubernetes APIs, Kueue, and SageMaker HyperPod task operators. With this unified view, you can trace model development task performance to cluster resources with aggregation of resource metrics at the task level. The solution also abstracts management of collector agents and scrapers across clusters, offering automatic scalability of collectors across nodes as the cluster grows. The dashboards feature intuitive navigation across metrics and visualizations to help users diagnose problems and take action faster. They are also fully customizable, supporting additional PromQL metric imports and custom Grafana layouts.
These capabilities save teams valuable time and resources during FM development, helping accelerate time-to-market and reduce the cost of generative AI innovations. Instead of spending hours or days configuring, collecting, and analyzing cluster telemetry systems, data scientists and machine learning (ML) engineers can now quickly identify training, tuning, and inference disruptions, underutilization of valuable GPU resources, and hardware performance issues. The pre-built, actionable insights of SageMaker HyperPod observability can be used in several common scenarios when operating FM workloads, such as:
- Data scientists can monitor resource utilization of submitted training and inference tasks at the per-GPU level, with insights into GPU memory and FLOPs
- AI researchers can troubleshoot sub-optimal time-to-first-token (TTFT) for their inferencing workloads by correlating the deployment metrics with the corresponding resource bottlenecks
- Cluster administrators can configure customizable alerts to send notifications to multiple destinations such as Amazon Simple Notification Service (Amazon SNS), PagerDuty, and Slack when hardware falls outside of recommended health thresholds
- Cluster administrators can quickly identify inefficient resource queuing patterns across teams or namespaces to reconfigure allocation and prioritization policies
In this post, we walk you through installing and using the unified dashboards of the out-of-the-box observability feature in SageMaker HyperPod. We cover the one-click installation from the Amazon SageMaker AI console, navigating the dashboard and metrics it consolidates, and advanced topics such as setting up custom alerts. If you have a running SageMaker HyperPod EKS cluster, then this post will help you understand how to quickly visualize key health and performance telemetry data to derive actionable insights.
Prerequisites
To get started with SageMaker HyperPod observability, you first need to enable AWS IAM Identity Center to use Amazon Managed Grafana. If IAM Identity Center isn’t already enabled in your account, refer to Getting started with IAM Identity Center. Additionally, create at least one user in the IAM Identity Center.
SageMaker HyperPod observability is available for SageMaker HyperPod clusters with an Amazon EKS orchestrator. If you don’t already have a SageMaker HyperPod cluster with an Amazon EKS orchestrator, refer to Amazon SageMaker HyperPod quickstart workshops for instructions to create one.
Enable SageMaker HyperPod observability
To enable SageMaker HyperPod observability, follow these steps:
- On the SageMaker AI console, choose Cluster management in the navigation pane.
- Open the cluster detail page from the SageMaker HyperPod clusters list.
- On the Dashboard tab, in the HyperPod Observability section, choose Quick installation.
SageMaker AI will create a new Prometheus workspace, a new Grafana workspace, and install the SageMaker HyperPod observability add-on to the EKS cluster. The installation typically completes within a few minutes.

When the installation process is complete, you can view the add-on details and metrics available.
- Choose Manage users to assign a user to a Grafana workspace.
- Choose Open dashboard in Grafana to open the Grafana dashboard.

- When prompted, sign in with IAM Identity Center with the user you configured as a prerequisite.

After signing in successfully, you will see the SageMaker HyperPod observability dashboard on Grafana.
SageMaker HyperPod observability dashboards
You can choose from multiple dashboards, including Cluster, Tasks, Inference, Training, and File system.
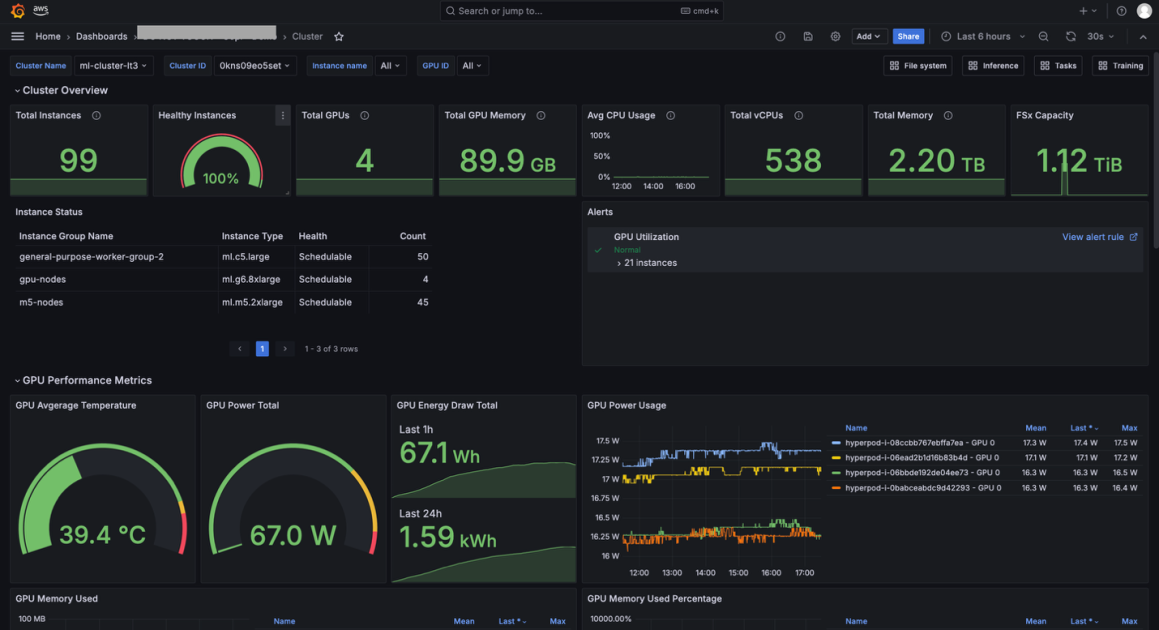
The Cluster dashboard shows cluster-level metrics such as Total Nodes and Total GPUs, and cluster node-level metrics such as GPU Utilization and Filesystem space available. By default, the dashboard shows metrics about entire cluster, but you can apply filters to show metrics only about a specific hostname or specific GPU ID.

The Tasks dashboard is helpful if you want to see resource allocation and utilization metrics at the task level (PyTorchJob, ReplicaSet, and so on). For example, you can compare GPU utilization by multiple tasks running on your cluster and identify which task should be improved.
You can also choose an aggregation level from multiple options (Namespace, Task Name, Task Pod), and apply filters (Namespace, Task Type, Task Name, Pod, GPU ID). You can use these aggregation and filtering capabilities to view metrics at the appropriate granularity and drill down into the specific issue you are investigating.

The Inference dashboard shows inference application specific metrics such as Incoming Requests, Latency, and Time to First Byte (TTFB). The Inference dashboard is particularly useful when you use SageMaker HyperPod clusters for inference and need to monitor the traffic of the requests and performance of models.

Advanced installation
The Quick installation option will create a new workspace for Prometheus and Grafana and select default metrics. If you want to reuse an existing workspace, select additional metrics, or enable Pod logging to Amazon CloudWatch Logs, use the Custom installation option. For more information, see Amazon SageMaker HyperPod.
Set up alerts
Amazon Managed Grafana includes access to an updated alerting system that centralizes alerting information in a single, searchable view (in the navigation pane, choose Alerts to create an alert). Alerting is useful when you want to receive timely notifications, such as when GPU utilization drops unexpectedly, when a disk usage of your shared file system exceeds 90%, when multiple instances become unavailable at the same time, and so on. The HyperPod observability dashboard in Amazon Managed Grafana has pre-configured alerts for few of these key metrics. You can create additional alert rules based on metrics or queries and set up multiple notification channels, such as emails and Slack messages. For instructions on setting up alerts with Slack messages, see the Setting Up Slack Alerts for Amazon Managed Grafana GitHub page.
The number of alerts is limited to 100 per Grafana workspace. If you need a more scalable solution, check out the alerting options in Amazon Managed Service for Prometheus.
High-level overview
The following diagram illustrates the architecture of the new HyperPod observability capability.

Clean up
If you want to uninstall the SageMaker HyperPod observability feature (for example, to reconfigure it), clean up the resources in the following order:
- Remove the SageMaker HyperPod observability add-on, either using the SageMaker AI console or Amazon EKS console.
- Delete the Grafana workspace on the Amazon Managed Grafana console.
- Delete the Prometheus workspace on the Amazon Managed Service for Prometheus console.
Conclusion
This post provided an overview and usage instructions for SageMaker HyperPod observability, a newly released observability feature for SageMaker HyperPod. This feature reduces the heavy lifting involved in setting up cluster observability and provides centralized visibility into cluster health status and performance metrics.
For more information about SageMaker HyperPod observability, see Amazon SageMaker HyperPod. Please leave your feedback on this post in the comments section.
About the authors
 Tomonori Shimomura is a Principal Solutions Architect on the Amazon SageMaker AI team, where he provides in-depth technical consultation to SageMaker AI customers and suggests product improvements to the product team. Before joining Amazon, he worked on the design and development of embedded software for video game consoles, and now he leverages his in-depth skills in Cloud side technology. In his free time, he enjoys playing video games, reading books, and writing software.
 Matt Nightingale is a Solutions Architect Manager on the AWS WWSO Frameworks team focusing on Generative AI Training and Inference. Matt specializes in distributed training architectures with a focus on hardware performance and reliability. Matt holds a bachelors degree from University of Virginia and is based in Boston, Massachusetts.
 Eric Saleh is a Senior GenAI Specialist at AWS, focusing on foundation model training and inference. He is partnering with top foundation model builders and AWS service teams to enable distributed training and inference at scale on AWS and lead joint GTM motions with strategic customers. Before joining AWS, Eric led product teams building enterprise AI/ML solutions, which included frontier GenAI services for fine-tuning, RAG, and managed inference. He holds a master’s degree in Business Analytics from UCLA Anderson.
 Piyush Kadam is a Senior Product Manager on the Amazon SageMaker AI team, where he specializes in LLMOps products that empower both startups and enterprise customers to rapidly experiment with and efficiently govern foundation models. With a Master’s degree in Computer Science from the University of California, Irvine, specializing in distributed systems and artificial intelligence, Piyush brings deep technical expertise to his role in shaping the future of cloud AI products.
 Aman Shanbhag is a Specialist Solutions Architect on the ML Frameworks team at Amazon Web Services (AWS), where he helps customers and partners with deploying ML training and inference solutions at scale. Before joining AWS, Aman graduated from Rice University with degrees in computer science, mathematics, and entrepreneurship.
 Bhaskar Pratap is a Senior Software Engineer with the Amazon SageMaker AI team. He is passionate about designing and building elegant systems that bring machine learning to people’s fingertips. Additionally, he has extensive experience with building scalable cloud storage services.
 Gopi Sekar is an Engineering Leader for the Amazon SageMaker AI team. He is dedicated to assisting customers and developing products that simplify the adaptation of machine learning to address real-world customer challenges.